Drivers of Achievement: Parental Education
Effect of Parental Education Level
A child’s likelihood to meet or exceed standards is strongly correlated with the parents’ education level. The gap in achievement between a child whose parents didn’t graduate high school and one whose parents completed graduate school is, on average, greater than that between a child who has been learning English less than 12 months and one who is fluent in English. It’s greater, on average, than the gap between a student with a disability and a student without. It’s greater on average than the gap between a student who is economically disadvantaged and one who is not. It’s about the same order of magnitude as the average gap between an Asian student and an African American one.
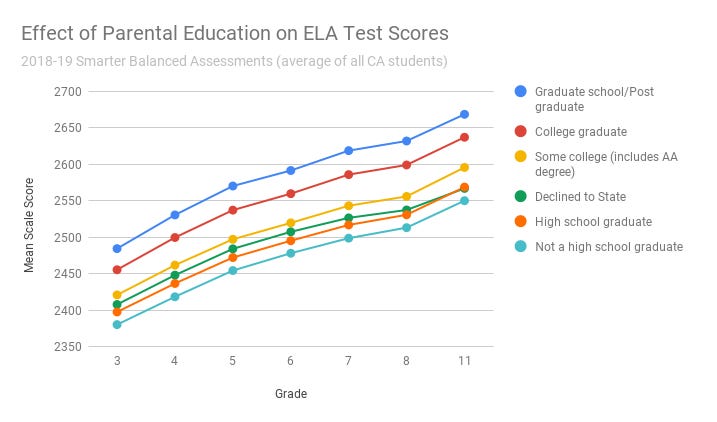
The scale of the effect can be seen in the following chart which shows the mean scale score for English-Language Arts for all students by grade, broken down by parental education level. Fifth-grade children whose parents completed graduate school had a mean scale score of 2570 in 2018-19, higher than the 2568 average obtained by eleventh-grade children whose parents only completed high school.
The effect is even more pronounced in Math where fourth-grade children of graduate school parents score higher than eleventh-grade children of high school graduates.
Much attention has been focused lately on proposed revisions to the California high school math curriculum that would force all students into the same math classes until 11th grade. It should be clear from this that high school is not the problem. By 8th grade, the average score of children whose parents didn’t complete high school is 2481.3. That’s lower than the average score of 2490.9 obtained in 3rd grade by children whose parents completed graduate school. If any two children are five grade levels apart in skill level, it’s hard to believe that either is best served by having them both in the same Math class.
Distance From Standard
California classifies individual scores into one of four buckets: Standard Not Met, Standard Nearly Met, Standard Met, and Standard Exceeded. The score required to achieve the Standard Met level increases from one grade to the next. Distance from Standard is defined as the difference between a score and the minimum score required to be in the Standard Met bucket. Here is the Difference from Standard by parental education level and grade for ELA.
Some groups start off below standard and stay there. Other groups start off above standard and stay there. For all of the groups, the Distance From Standard doesn’t vary much between grades 3 and 8 but then jumps in 11th grade.
The chart for Math looks different. Children whose parents didn’t complete college get further and further below standard as they progress through school. Even children whose parents are college graduates slip below standard by 11th grade.
Identifying High Performing Districts
Imagine we have two school districts, one where 80% of the children have college graduate parents and 20% have parents who graduated high school and the other where the percentages are reversed: 20% of parents are college graduates and 80% are high school graduates. Now suppose that children of college graduates score the same in both districts and children of high school graduates score the same in both districts but lower than the children of college graduates. Both districts are equally good at educating their children but the one with more college graduate parents will report better headline results.
We can control for the effect of parental education by comparing a district’s actual scores for each parental education level with the statewide average scores for that parental education level. That’ll tell us whether, for example, the children of high school graduates in the district outperform the children of high school graduates elsewhere in the state. We can calculate a single measure of a district’s performance by weighting these numbers by the statewide distribution (17% not high school graduate, 23% high school graduate, 23% some college, 22% college graduate, 16% postgraduate degree).
Here’s a graph showing all districts with at least 5000 test takers. The size of the disc represents the number of students in the district. The y-axis here is the weighted average scale score difference between the district’s students and the statewide average.
There are a few things to note here:
Districts such as Clovis, Garden Grove, ABC, and Long Beach that looked good when we examined performance by economic status and race also look good here.
Bay Area districts seem to underperform in general, despite having higher than average parental education levels.
SFUSD looks pretty good. Sadly, this is a mirage because SFUSD’s data is unreliable. I’ll explain why later.
Having controlled for parental education, I expected that this chart would show no dependence on the parental education level. In other words, there would be no pattern in whether districts were above zero or below zero. Instead, there is a clear upward trend as the percentage of college graduates among the parent body increases.
If we group schools according to the percentage of college graduates among the parents and then compare the performance of students in those schools with the performance of students with similarly educated parents elsewhere in the state, we get the following chart.
To understand what this chart is showing, consider the schools where between 20% and 30% of the parent body graduated college. For those schools, the chart shows a green dot at about -5, a red dot at about -30, and a blue dot at -60. This does NOT mean that children of high school graduates scored higher than children of college graduates. It means that children of high school graduates scored 5 points worse than the average child of high school graduates, that children of college graduates scored 30 points worse than the average child of college graduates, and that children of postgraduates scored 60 points worse than the average child of postgraduates. The chart demonstrates that:
The more college graduates there are among the parents in a school, the better all students do.
If there are few college graduates among the parents, then the children of the most educated parents are hurt the most i.e. they underperform children of similarly educated parents.
This could be because districts with high numbers of college graduates have objectively better schools (i.e. schools that are able to teach more to everyone) or it could be because there’s a lot of sorting going on that is not captured by parental education level. For example, the college graduate parents in schools with low numbers of college graduate parents may be more likely to be economically disadvantaged (which we know is also linked to performance).
This has implications for districts, like SFUSD, that are considering changes to their student assignment systems. It explains both why districts might want to spread the kids of college graduates evenly around the schools and why the more educated parents might be motivated to fight such changes.
Why SFUSD’s data is Unreliable.
One of the charts above showed SFUSD doing better than most districts in ELA after controlling for parental education. The data for Math shows the same thing: SFUSD appears to beat the state average substantially for all education levels.
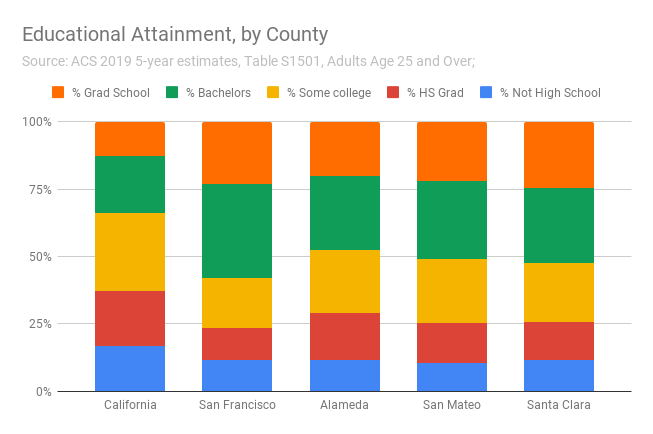
The first hint that the data is suspect comes from mix of parental education levels found. Here’s how the supposed parental education level in San Francisco compares with that of neighboring counties and the state of California.
It appears from the data as if San Francisco students have less well educated parents than the average California student, never mind those in neighboring counties. This is very unlikely to be true. Here are the census bureau estimates for adult educational attainment for the same areas:
San Francisco actually has a much higher percentage of college graduates and above than the state average. Its percentage of college graduates is also significantly higher than those of neighboring counties. Of course, not all residents are equally likely to be parents. In comparison with other counties, San Francisco’s college graduates may be less likely to have children or more likely to send their children to private school. But it is implausible that San Francisco’s parents are less well educated than the state average, as the Smarter Balanced Assessment data seems to show.
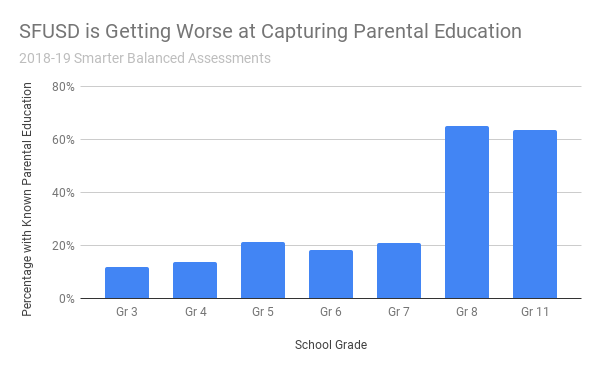
Why can’t the SFUSD data be trusted? First, SFUSD doesn’t capture the data for most students. Across the state, parental education is captured for about 89% of students with more than half of districts capturing it for more than 95% of their students, as the following histogram shows. SFUSD is in the barely visible bucket at 30%. San Francisco charter schools are able to capture this data for over 90% of their students so the issue is clearly one of will on the part of SFUSD, not of general reluctance on the part of San Francisco parents.
Second, it’s actually getting worse. Within SFUSD, the percentage with any stated parental education level in 2018-19 was over 60% for grades 8, around 20% for grades 5 to 7 and only 13% in grade 3.
This decline may be due to SFUSD’s history. Until 2011, SFUSD used to base kindergarten admissions on a diversity lottery and one of the factors used to capture diversity was parental education level. Children who were 7th graders in 2018-19 would have entered kindergarten in 2011 and would have been the first whose parents’ education level didn’t factor in to their school assignment.
Third, the data they do capture may be unreliable. Parental education level is a checkbox on the school enrollment form. A friend has a postgraduate degree from MIT and her husband is a high-school graduate. When registering their children, should she have entered her level or her husband’s? The form provides no guidance.
One of the reasons SFUSD got rid of the diversity lottery was the belief that parents were “gaming the system by misreporting characteristics”. In other words, parents would report a lower education level in the belief that this would increase their chances of getting their child admitted to the school of their choice. There’s a way to test this. If this were happening in significant quantities, then the reported parental education levels for the younger grades (for whom it didn’t factor into admissions) should be higher than for the higher grades (for whom it did factor into admissions). Here’s what the data shows:
I see no clear trend there. The percentage of children whose parents have no more than a high school education was about 50% among the Grade 3 and Grade 11 students. Perhaps gaming was nowhere near as prevalent as SFUSD feared. Of course, when only 12-14% of parents are declaring their education level, the obvious question is which parents are choosing to fill out that part of the enrollment form. Unless it’s a random sample, the data is unreliable.
If SFUSD’s parental education records are unreliable, can we say anything useful about the impact of parental education in San Francisco? Yes. Here’s the percentage of adults with a Bachelor’s Degree or Higher in each county in California, broken down by race/ethnicity. The White adult population in San Francisco is exceptionally well educated: 77% have a bachelor’s degree or higher, far higher than any other county. Marin comes second at 66.5%, and Santa Clara, San Mateo, and Alameda are the only other counties to be over 60%. This makes it almost certain that White parents of SFUSD students are more educated than White parents in most other districts. Since student achievement is so strongly correlated with parental education, this explains why White students achieve at a higher level in SFUSD than in most other districts. SFUSD isn’t favoring them either intentionally or unintentionally - the students just have exceptionally well educated parents.
Parental education might also explain the comparative underperformance of Asian students. Only 47% of Asian adults in San Francisco have bachelor’s degrees, behind 19 other counties including Santa Clara which leads at 66%. But looking at parental education only makes the underperformance of Latino and Black students even harder to explain. San Francisco ranks #1 in percentage of Latino adults with a bachelor’s degree (34%) and #7 in percentage of Black adults with a bachelor’s degree (31%).


