Introduction
The last post compared elementary school class sizes in San Francisco and other school districts. It found that SFUSD’s class sizes, particularly at the 1st grade level, were much smaller than in other districts and argued that they were probably too small and that the money should be used for other purposes.
But San Francisco, despite its budget crisis, has more money than most other districts thanks to the generosity of San Francisco voters. Do other grades also enjoy smaller class sizes than their peers?
The short answer is no. The longer answer is that it depends on the school.
Middle School Class Sizes
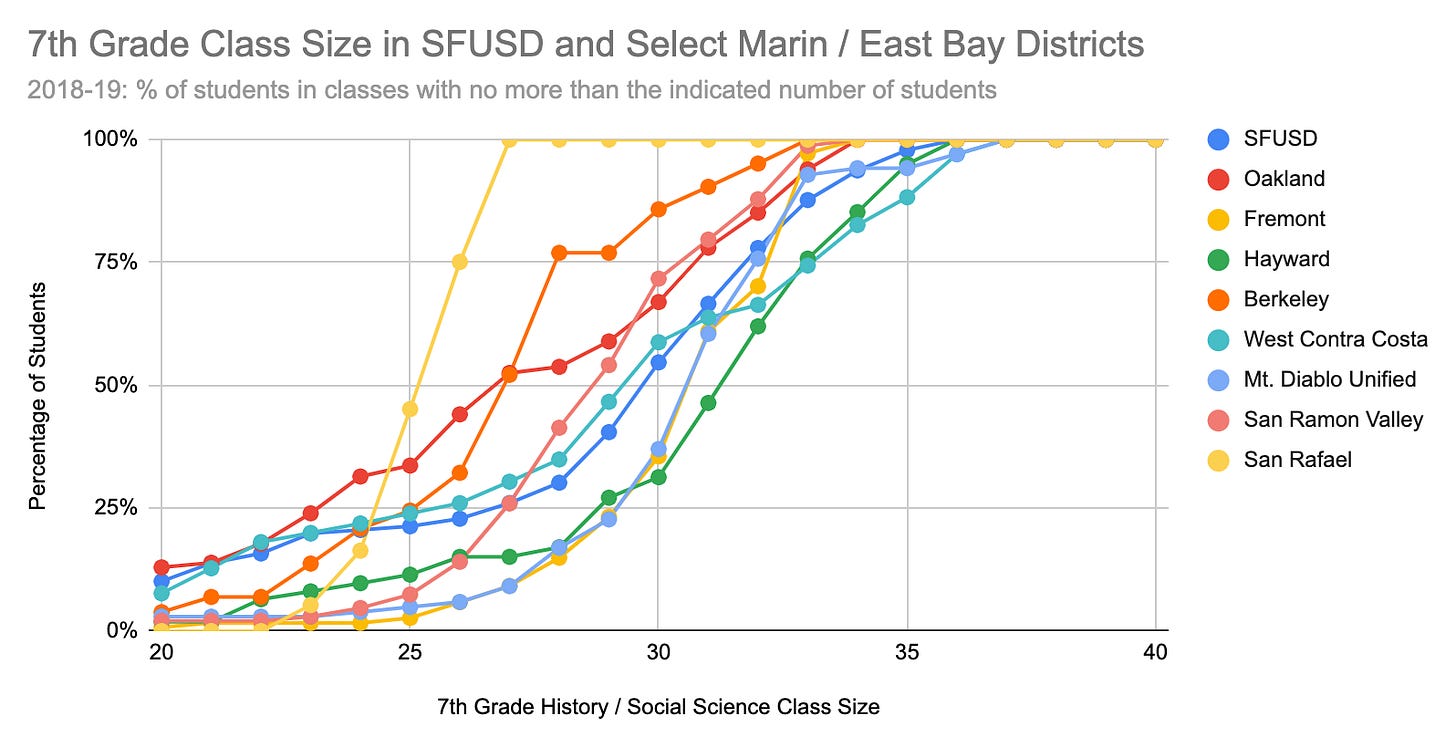
It’s trickier to analyze middle school class sizes than elementary school class sizes. Most elementary school classes are coded in CDE’s system as “Self-Contained Class” (course code 1000: A class that provides instruction in multiple content areas and is delivered in one classroom to one group of students). By middle school, students are taking multiple different subjects from different teachers. To represent middle school class sizes, I chose to focus on 7th grade History / Social Science. Most districts stream their middle school math students and many have sizable numbers of students in remedial English classes which are smaller than regular classes. Every student takes a History / Social Science class and these classes tend not to be streamed by ability so they represent well the class sizes offered in each school and district.
As I did with elementary schools, I’m going to compare SFUSD to a small sample of high-performing districts, to some of the largest districts on the peninsula, and to some of the largest in the East Bay and Marin.
To help with interpreting these charts, imagine there was a school with 150 students distributed among classes of 20, 25, 30, 35, and 40. 13% (=20/150) of students are in classes of 20 or fewer and 30% ((20+25)/150) are in classes of 25 or fewer. Here 21% of SFUSD’s students are in classes of 25 or fewer and 55% are in classes of 30 or fewer. San Francisco’s 7th grade class sizes are a bit smaller than those in our high-performing districts but the gap is much smaller than it is at the 1st grade level.
San Francisco’s 7th grade class sizes are a bit smaller than those in the high-performing districts but the gap is much smaller than it is at the 1st grade level. In comparison to other Bay Area districts, San Francisco is a bit below the middle of the distribution. 55% of its 7th graders are in classes of 30 or fewer students, a smaller percentage than those in San Jose, Santa Clara, Berkeley, or Oakland but still higher than those in Cupertino or South San Francisco or Hayward.
Within San Francisco, a majority of schools average around 30 but some are significantly smaller. These schools are staffed as if they were fully enrolled but staffing has not been reassigned to reflect actual enrollment patterns. Why, for example, does Bessie Carmichael average over 30 but Buena Vista Horace Mann is just over 20?
High School Class Sizes
To represent high school class sizes, I looked at two separate things:
9th grade Science (which is usually Biology or Physics) because it’s a subject that every high schooler must take and the results aren’t going to be distorted by small remedial classes or streaming. They can, however, be distorted by reporting issues. Consider Sequoia Union High in San Mateo county. Carlmont, one of the schools in that district, reported 21 Biology classes with class sizes ranging from 17 to 31 (which seems plausible) but Menlo-Atherton, in the same district, reported 27 Biology classes with sizes ranging from 1 to 17 (which is suspicious).
the universe of all high school classes. This gets a bit messy because many schools have a few classes that are extremely large which can distort the results. Most of these extremely large classes are Physical Education or Music classes (e.g. Band, Choir) which are not what we are usually concerned about when we think about class sizes. To take the extreme case, Burton had a Physical Education class of 166 students. I considered excluding all very large classes. But SOTA, for example, had a Health class with over 100 students. I didn’t know whether that was a real class (where did it meet?) or a reporting artifact.
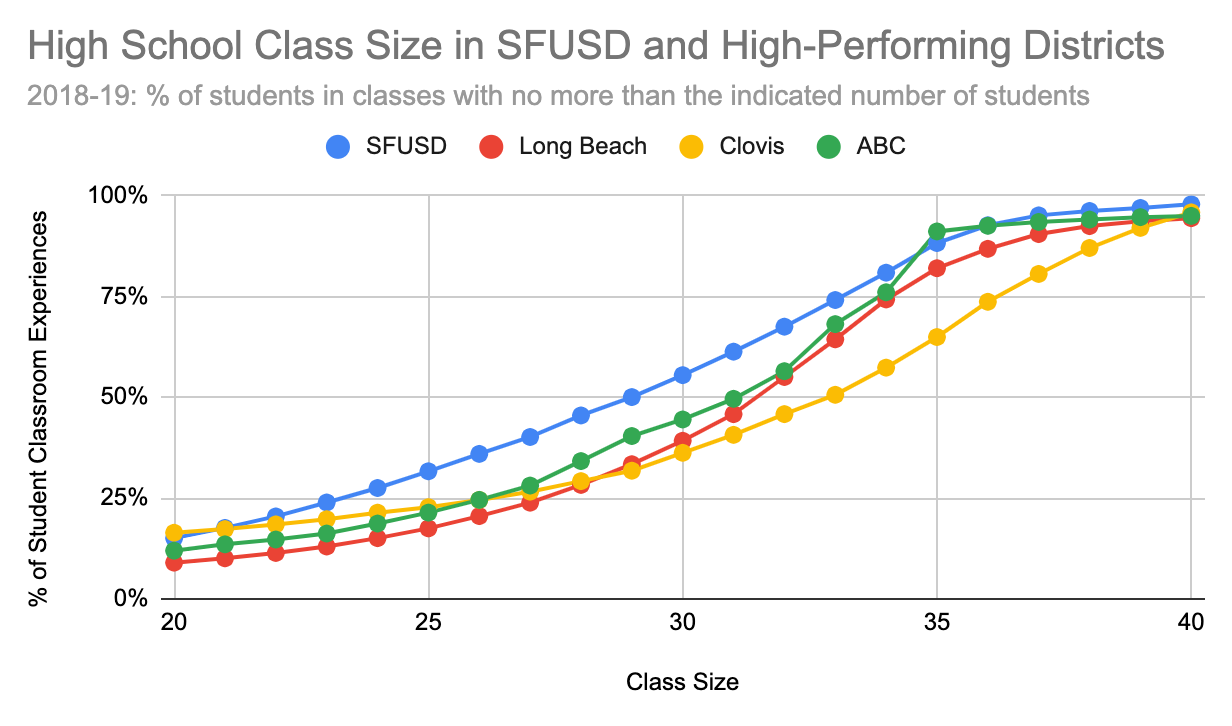
Here are the comparison charts for all high school classes.
SFUSD has generally smaller classes than the high performing districts but the gap is not as great as at the elementary school level.
Compared to the other Bay Area districts, SFUSD has more kids in classes with fewer than 25 students but the edge disappears after that. The number of kids in classes over 30 is entirely average.
Many of these districts, such as San Jose Unified and Fremont Union High) are dependent on the state’s Local Control Funding Formula for their money. Others, like Sequoia, San Mateo Union High, Palo Alto Unified, and San Rafael City High get far more money in property taxes than they would receive if they were dependent on the state Local Control Funding Formula. I am surprised that this doesn’t reliably show up in class sizes. It does for some (e.g. Palo Alto, San Rafael) but not for others (e.g. Sequoia Union High, San Mateo Union High). Oakland’s small reported sizes should be taken with a pinch of salt. They are almost certainly due to the same sort of reporting issues that happen at Menlo-Atherton High
Within San Francisco
The charter high schools in San Francisco (City Arts and Tech, Gateway, Leadership, and KIPP), offer significantly smaller class sizes than SFUSD.
Moreover, unlike in at the K-3 level, there is a great difference in class size across schools.
The schools are listed in decreasing order of enrollment. To aid readability (it’s hard to distinguish 14 different colors), the largest schools have each point marked, the ones with 400 - 1000 students are shown with solid lines and the smallest schools are shown with dashed lines. The range of values here is hard to justify. Why, for example, should the class sizes in Burton and Mission be so different?
To see if this huge variation is normal, I compared it with Long Beach, SFUSD’s favorite benchmark. The schools are again listed in order of size. CAMS is its academically selective school; Sato is STEM-focused and Renaissance is Arts-focused. As we can see, there is much less variation from school to school in Long Beach.
Conclusion
We have seen that San Francisco’s middle and high-school class sizes are not smaller than those of other Bay Area districts but that this average hides a huge variation from school to school within the city.
Here’s how the class size of the median student changes throughout their education, using the 1st grade class size as the basis. The median 1st grader in SFUSD is in a class of 21 while the median 7th grader is in a class of 30 which is 43% higher.
The K-3 years enjoy the smallest class sizes in all districts but the amount by which the class sizes increase in later grades varies significantly from district to district. There is clearly no consensus among districts about what the appropriate class size gradient is. In San Francisco and Clovis, middle school has the highest class size. It is hard to imagine a pedagogical justification for this.
Because there is so much school-to-school variation within the city, the picture looks even worse if we look at the 75th percentile. 75% of SFUSD’s 1st grade students are in classes of 22 or smaller. The comparable numbers for the other grades are 30 (4th/5th grade), 32 (7th grade History), 31 (9th grade Science), and 34 (all high school). No other district exhibits this pattern. This supports the conclusion that SFUSD is investing too much in its elementary schools at the expense of its middle and high schools.


