

The Impact of Pandemic School Closures on Student Achievement in SFUD
Fewer students meeting standards, particularly in middle school
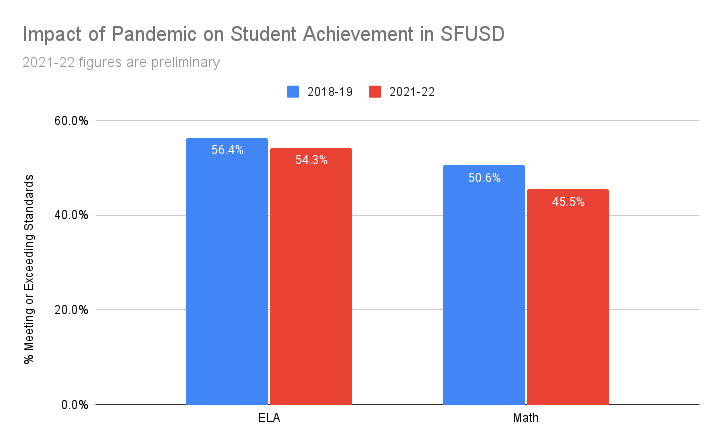
How much did the prolonged school closures during the pandemic affect students’ education? The full data for 2021-22 has not yet been made public but the SFUSD Board of Education got a preview of preliminary data.
The percentage of students meeting or exceeding standards in Math fell a full five percentage points from 50.6% to 45.5%. The drop in ELA was less severe. It fell by 2.1% from 56.4% to 54.3%.
As the following chart shows, all grades were not affected equally. Students in middle school suffered most. The percentage of 7th graders at or above standards in Math fell 12 percentage points, from 52.9% to 40.9%.

It’s easy to come up with a plausible explanation for why the 7th graders scored so badly. Students who were in 7th grade last year were in 6th grade in 2020-21 when the schools were entirely online for the whole year. 6th grade is the middle school transition point so they would have had to adjust to transition to a new school that they’d never visited and new classmates that they’d never met entirely online. When the detailed school-by-school data comes out, it will be possible to test this hypothesis. If it’s correct, students in K-8 schools should come out ahead of students who had to switch from an elementary school to a middle school.
It’s interesting that 5th grade students were much more affected than 3rd and 4th grade students. One possible explanation is that the 5th graders would have been 4th graders during the year of online learning and 4th grade is a hidden transition point in SFUSD. Kids don’t change school but they have to get used to much larger class sizes. SFUSD class sizes max out at 22 students in grades K-3 but go up to over 30 in many schools in grades 4-5.
High school students were affected least. Indeed, the percentage who met or exceeded standards in ELA actually increased. It is possible that being older, they were better able to adjust to online learning. The prospect of college on the horizon might have also kept them focused.
Impact By Racial and Ethnic Group
All racial and ethnic groups lost ground. Here’s the chart for ELA

And here’s the chart for Math.

The percentage who met or exceeded standards in Math dropped from 72% to 65% among Asian students and from 22% to 18% among Latino students. Even though a 7 percentage point drop is bigger than a 4 percentage point drop, I interpret these figures to show that Latino students were more affected because 4%/22% is bigger than 7%/72%. Someone else might argue that this shows that the “achievement gap” has been narrowed from 50% (72% - 22%) to 47% (65%-18%). This just shows how misleading the achievement gap is as a measure of the district’s performance and anyone who does make this argument should be ignored: in no world is 65% and 18% better than 72% and 22%.
The numbers shown here for Black students, bad as they are, probably understate the decline. The 9% is the number of students who met or exceeded the standard divided by the number who took the test. But SBAC tests are not mandatory and some students choose to opt out. We can calculate the percentage of eligible students who took the SBAC by dividing the number of test takers by the enrollment in grades 3-8 and grade 11. The percentage of test takers dropped for all groups between 2018-19 and 2021-22 but the drop was most significant for Black students. Only 80% of eligible students took the SBAC tests, down from 89% in 2018-19. It’s a reasonable assumption that those who don’t the sit the test are less likely to be performing at grade level than those who do sit it. No one likes to sit a test they think they’re going to do badly in. (A quick illustration that can be seen directly in the data: most student groups are more likely to sit the ELA test than the Math test but Asian and Latino students, who are more likely to be English Learners, are more likely to sit the Math test than the ELA test.)

Special Education
The numbers for Special Education students deserve study. The percentage meeting or exceeding standards rose from 17% to 25% in ELA and from 16% to 20% in Math. My first thought was that this was amazingly good news. But then I noticed that the number of Special Ed test takers rose by 29% (from around 2800 to around 3600) at the same time that the overall number of test takers was down by 8%. The simplest interpretation is that the criteria for Special Education eligibility were loosened and the newly eligible students, being less in need of Special Ed in the first place, were far more likely to meet or exceed standards.
Two great analyses posted on back-to-back days, especially for back-to-school :) ! Thanks for crunching the data and spotlighting important considerations for local education policymakers, parents, and the public!