When the 2022 Smarter Balanced Assessment Consortium (SBAC) results were officially published last week, SFUSD issued a press release touting its results. The last post looked at the comparison between SFUSD and other districts. This post will focus on what SFUSD had to say about the performance of its own schools.
Overall Proficiency
The press release says:
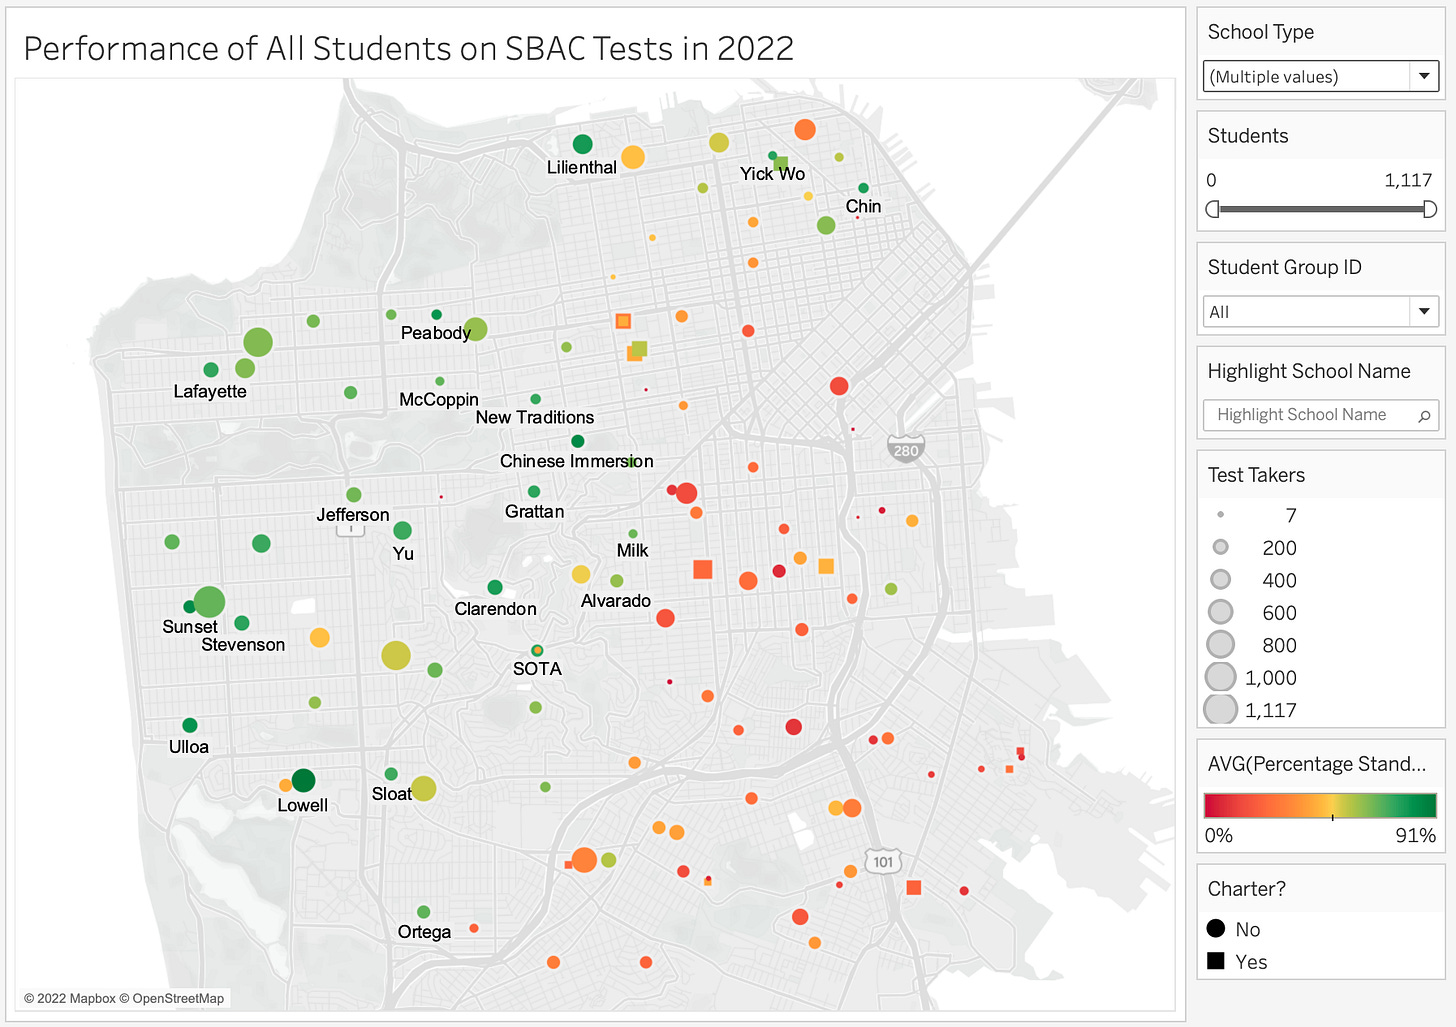
Schools that have an overall proficiency rate above 75% in both content areas, ELA and Math, are Sunset Elementary, Chinese Immersion School, Peabody Elementary, Ulloa Elementary, John Y. Chin Elementary, Yick Wo Elementary, Claire Lilienthal K-8, and Lowell High School.
This is an accurate statement. Figure 1 shows how every school in the district scores. The associated tableau allows you to mouseover each school and see its data.
Although the named schools are all fine schools, their high ranking is as much a reflection of their composition as the quality of the teaching. All the demographic groups for which we have data do well at these schools but Sunset, Chinese Immersion, Chin, and Yick Wo don’t have enough Latino or Black students to even register a score for those groups. Chin doesn’t even have enough White or Two or more Race kids to register scores for those groups. Peabody and Ulloa have scores for Latino students but not for Black students or for Latino SED students. Lowell didn’t record a score for Black students. Only Lilienthal has enough Latino SED and Black SED students to register scores for them. Unfortunately, its few Black SED students underperform even SFUSD’s terrible average for Black SED students (1 of 14 test takers was proficient in ELA; 0 of 14 in Math).
The following schools also do better than the SFUSD average for every combination of race/ethnicity and socio-economic status that’s large enough to register a score: Alvarado, Asawa SOTA, Clarendon, Grattan, Lafayette, McKinley, New Traditions, Ortega, Yu. Figure 2 is a map of the average proficiency (i.e. the average of the Math and ELA proficiency levels) of all schools in the district. I’ve labeled all the schools named so far. It’s obvious that they are all located in areas with large Asian and/or White populations. Note that nearly all are elementary or K-8 schools. None is a middle school. We’ll revisit that in the next post. For now, let’s return to the district’s claims.
Black Students
The district made the following claim about Black student proficiency.
Sherman Elementary, Cobb Elementary, Wallenberg High School, Washington High School, and Presidio Middle School have African American student proficiency rates 10% higher than the District average for African American students in ELA and Math.
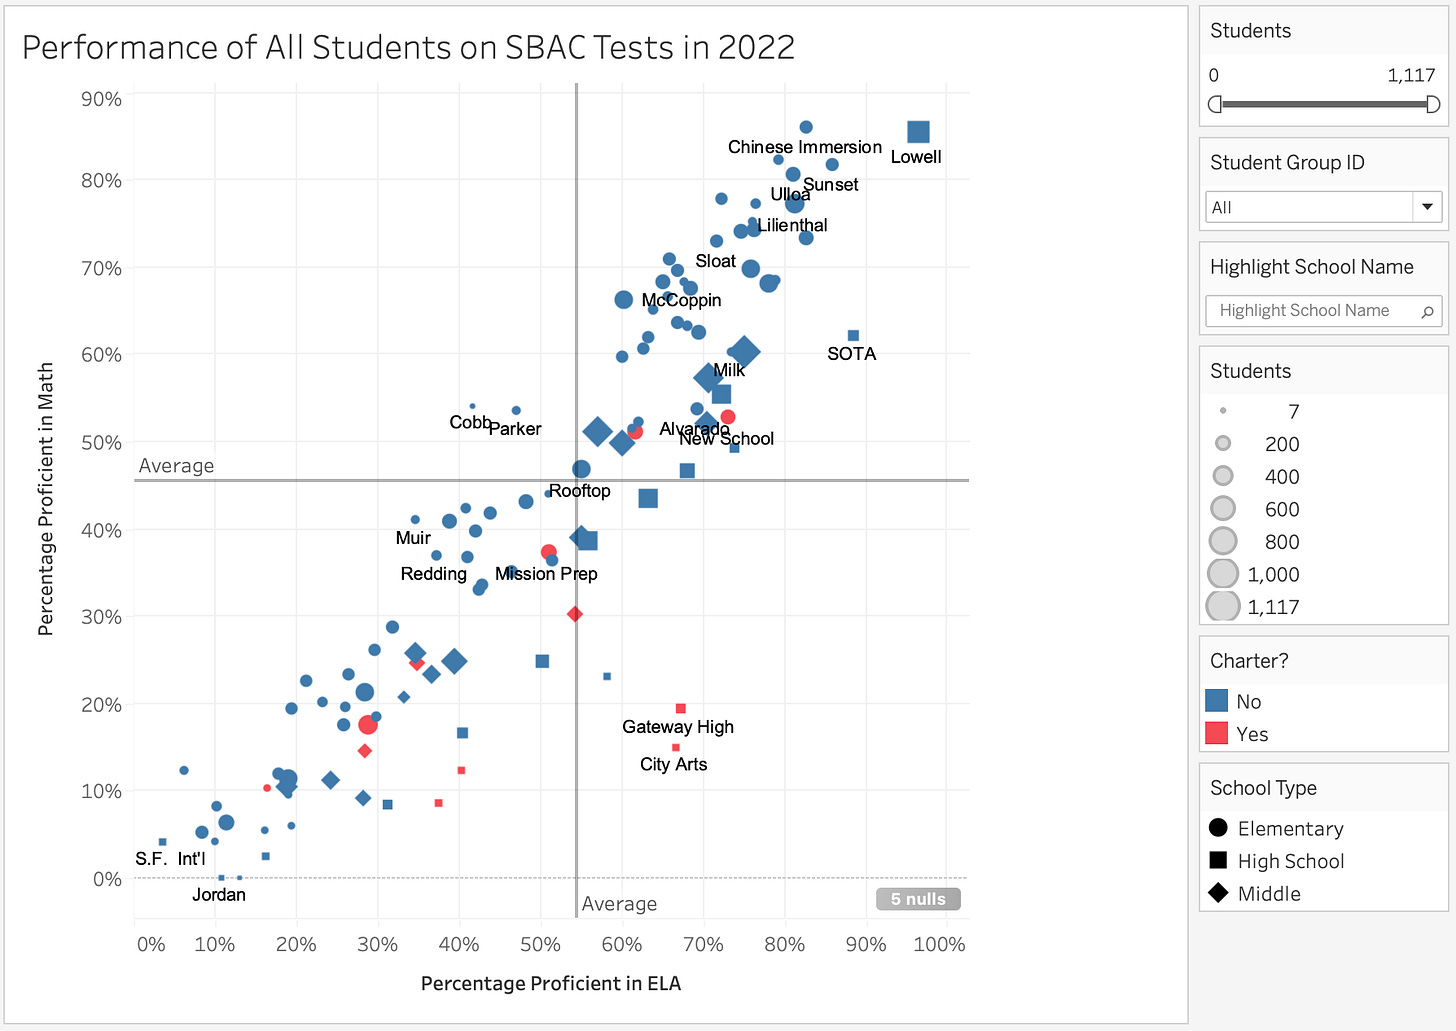
According to the public data, only 10 Wallenberg students sat the Math test which is not enough to generate a score. Maybe the district is using private data. At Presidio, 3 out of 25 (12%) were proficient in Math which is higher than the district average (9.08%) but not 10% higher. The claim is true for Sherman, Cobb, and Washington but unfortunately we’re dealing with very small numbers. Only 9.08% of Black students were proficient in Math so the threshold is to be higher than 19.08%. The actual numbers were 5 out of 18 at Sherman, 4 out of 12 at Cobb, and 3 out of 12 at Washington. You might be surprised not to see Lowell on the list. The public data contains no data at all for Lowell - perhaps the Black students boycotted the tests en masse. Figure 3 shows the performance of Black students at all schools that had enough of them to record a score. The horizontal reference line represents the district average proficiency for Math (9.08%) and the vertical reference line is the district average proficiency for ELA (17.95%).
There are fifteen schools (twelve district, three charter) that have zero Black students who are proficient in Math. A good number of the schools got poor results in both Math and ELA but Gateway High managed the bizarre feat of combining a creditable 41% proficiency in ELA (7 of 17) with 0% proficiency in Math. KIPP SF College Prep. also had a big difference between a creditable 39% proficiency in ELA and a poor 6% in Math.
Another charter, New School, has the highest proficiency rates in both ELA and Math but the absolute numbers are again so small (only 12 test takers) that it’s impossible to know how much credit to give the school. The only schools to have more than twenty test takers and be above average in both ELA and Math were Marina, AP Giannini, Presidio, John Muir, Claire Lilienthal, Alice Fong Yu, and KIPP SF Bay Academy.
Black SED Students
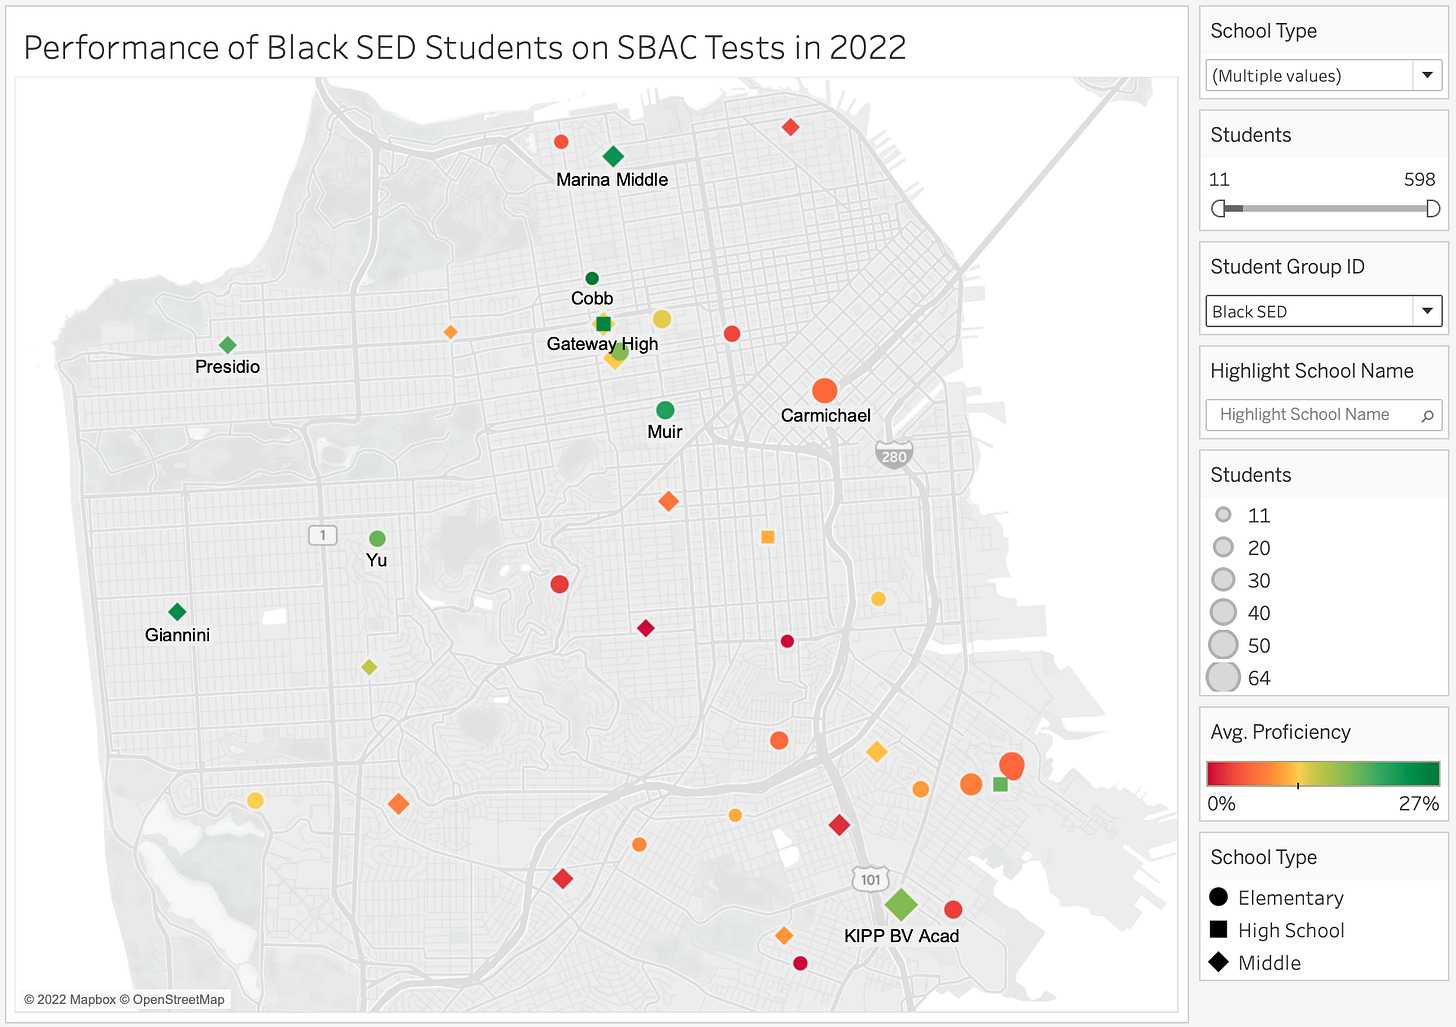
Let’s narrow the focus to socioeconomically disadvantaged (SED) Black students. There were fewer than 1000 Black SED test takers across San Francisco and a minimum of 11 are needed for a school to record a score so some of the higher performing schools mentioned above didn’t have enough SED test takers to record a score. Figure 4 is a map of the schools that did record a score. Note that the sample sizes at each school are quite small. No school had more than 64 Black SED test takers. The color palette is centered on 10.65%, the average proficiency of this group of students (6.93% in Math and 14.36% in ELA).

The schools that show up in green are a bunch of charter schools (KIPP Bayview Academy, KIPP SF College Prep, Gateway High, Creative Arts), two district schools near the Western Addition (Cobb, Muir) and several district middle schools (Marina, AP Gianinni, Presidio). All of the district schools in the southeast are below average.
Latino Students
The district’s claim about Latino student proficiency was phrased differently than its claim about Black student proficiency. Instead of being about schools where the rates were “10% higher than the district average”, they went for a statement about absolute proficiency rates.
Schools that have proficiency rates above 50% for Latinx students in both content areas, ELA and Math, are Clarendon Elementary, McCoppin Elementary, Sunset Elementary, Harvey Milk Elementary, New Traditions Elementary, Lafayette Elementary, Peabody Elementary, Ulloa Elementary, Grattan Elementary, Jefferson Elementary, Sloat Elementary, Stevenson Elementary, Alice Fong Yu K-8, Claire Lilienthal K-8, and Ruth Asawa School of the Arts.
Only 18% of SFUSD’s Latino students were proficient in Math so a threshold of 50% is high. I was a little surprised at first that so many schools exceeded so high a threshold. Here’s the underlying data for all schools.
the high performing schools have tiny numbers of Latino students and are all in the west or north of the city. There were twenty schools in the district (and two charter schools) with more than 100 Latino test takers but, of the high proficiency schools, only Lilienthal (with 45) had more than 31 test takers. There are more Latino students who are proficient at Mission Prep than at Sloat, Milk, McCoppin, Peabody, Grattan, Redding, Ulloa, and New Traditions combined.
It is impossible to verify the figures for Sunset and Stevenson because they had so few Latino test takers that CDE didn’t publish figures for them.
Only 39% of Alice Fong Yu’s Latino students were proficient in Math so it’s not clear why that school was included in the list. On the other hand, Redding Elementary should have been included because it met the threshold as the graph shows.
Lowell didn’t make the list because the criterion was to exceed 50% in both ELA and Math. 89% of Lowell’s Latino students were proficient in ELA but only 47% in Math, a stunningly large difference. In previous years, the ELA proficiency rate has always been over 80% but the Math proficiency rate has never been lower than 57%. In fact, many high schools exhibited large differences between ELA and Math proficiency levels. At Balboa, the gap was 39% (53% to 14%). At SOTA, it was 36% (93% to 57%). At Galileo, it was 29% (40% to 11%).
A key question that the data cannot answer is whether the named schools get excellent results for their Latino students because they are good schools or because the Latino parents who choose to send their children to these schools are not representative of all Latino parents, but are instead better educated, or more likely to speak English at home, or just more involved with their kids’ education. It is certainly true that the few Latino students they do have are comparatively well off. Overall, about 68% of the Latino test takers in SFUSD were SED but only about 34% of the students in the named schools were SED. This means that if we restrict the analysis to Latino students who are socioeconomically disadvantaged, most of the schools have too few test takers from that group to register a score.
Figure 6 shows each school’s average proficiency (meaning the average of the percentage who were proficient in ELA and the percentage who were proficient in Math) for those students. The color palette is set so that the the center of the color spectrum (i.e. gold) is set to be 19.01%, the district-wide average for Latino SED students (24.51% in ELA and 13.51% in Math). This map makes clear how few Latino SED students are served by the schools mentioned by the district. The only district schools in the city to have at least 20 Latino SED students and a proficiency rate for those students of at least 25% (a pretty low bar) are Muir, Alvarado, Moscone, and Lakeshore elementary schools, Presidio Middle School. Of the schools that actually serve many disadvantaged Latino students, Mission Prep and KIPP SF Bay Academy, both charter schools, stand out.

Asian Students
SFUSD made no claims about which schools had high proficiency rates for Asian students. As a comparison, Figure 7 is a map showing the performance of socioeconomically disadvantaged Asian students. The color shading is set so that gold, the midpoint of the red-green spectrum, is at 64%, the average proficiency rate of Asian SED students. The highest scoring elementary schools are those in the Sunset including Ulloa, Sunset, and Stevenson. Nearby Feinstein and Lakeshore have fewer Asian SED students and they don’t do as well. Most of the schools in the Mission / Noe Valley / Glen Park areas are not shown simply because they didn’t have enough Asian SED students to register a score.

Of the middle schools, AP Giannini is above average, Hoover and Presidio are close to the average and the others are below average with Francisco middle school in North Beach having the lowest proficiency rates of all.
White Students
The district also made no claim about proficiency of White students. Most White students are not socioeconomically disadvantaged so figure 8 shows the performance of White non-SED students. Again, the color palette is centered on the average for this group of students which happens to be 75% proficiency. There is a concentration of high proficiency schools in the central part of the city (Milk, West Portal, Clarendon, Sloat, Alvarado, Sunnyside) with others in the North (Lilienthal) and West (Sunset).

Further Exploration
This tableau page contains charts for additional groups (e.g. Filipino students) and a tool that allows you to compare the proficiency rates at selected schools. For example, here are three middle schools.


It would be interesting if they provided data by race for parent education. Looking at past data there was a big jump in the percent that exceeds the standard for parents with a professional or graduate degree.
What percentage if each group takes the test? It seems that an easy way to game the system would be to discourage SED students from taking the test.
Lowell and SOTA deserve their reputations, it appears that Lincoln does not.
Latino SED students do well in Westside schools, especially Lowell. It’s too bad that more cannot attend.