The new school year has started and this substack has returned from its Summer break. First up are a few posts about attendance and absenteeism, which is a hot topic at the moment. Carol Kocivar wrote recently about post-pandemic attendance rates in SFUSD and it was one of several topics mentioned by the Chronicle in its back-to-school article. Before considering the impact of the pandemic, let’s start by going back to 2018-19, the last pre-pandemic year, because chronic absenteeism is not a new problem in San Francisco.
The California Department of Education (CDE) publishes two types of data about attendance. The first concerns the rate of chronic absenteeism, which is defined as missing one tenth or more of the school year or 18 of the 180 days in a standard school year. A student is either chronically absent or not. The second piece of data concerns the average number of days missed by students and whether those missed days were excused or unexcused absences. We’ll make use of both.
Chronic Absenteeism by Grade
Chronic absenteeism is at its highest in kindergarten, but is otherwise at its lowest in elementary school, before rising in middle school and especially in high school. The high kindergarten rate is partially due to parents not taking kindergarten as seriously as other grades .
The standard CDE data doesn’t show support a breakdown by grade and race (just grade or race) but a report by the California Attorney General’s office using data from a few years earlier shows that higher rates of chronic absenteeism among Black kids starts in kindergarten.
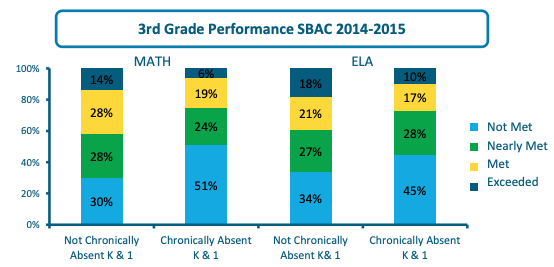
The CDE data also doesn’t show the direct link between attendance and achievement but the 2016 AG report showed that: “Three-quarters of students who were chronically absent in kindergarten and first grade did not meet the California state standards in math and English language arts in the third grade”
Rates of Chronic Absenteeism
The CDE tracks absenteeism rates by demographic group. Across the state, 12% of students are chronically absent, but some groups have significantly higher rates e.g. kids who are socio-economically disadvantaged (15%), or have disabilities (20%), or who are homeless (25%) or in foster care (27%). Those groups also all do worse on standardized tests than the average.
There are some surprises. English learners do a lot worse on standardized tests than the average but they are only marginally more likely than the average to be chronically absent (12.2%). I suspect part of the explanation is that there’s a higher percentage of high attendance Asian kids among the English learners than among the general student population.
Most surprising to me is that kids who are migrants are LESS likely (9%) than the average student to be chronically absent. If you have a theory for that, please let me know because I can’t come up with a plausible one.
The relationship between attendance and achievement can be seen when we break it down by race and ethnicity. The groups that do best on standardized tests have much lower rates of chronic absenteeism than the groups that do worse. Statistically, 86% of the observed differences in achievement can be explained by the difference in chronic absenteeism.
Just because absenteeism and achievement are closely related doesn’t mean one causes the other. The causation runs both ways: kids who are absent a lot are less likely to meet state achievement standards and kids who are below standard are more likely to skip school, thereby falling further behind.
An R-squared of 0.862 is really high but it’s important not to get carried away and think that equalizing attendance would equalize achievement. It’s a lot more complicated. If we look at all the districts with at least 1000 Latino students and compare the chronic absenteeism rate among Latino students in those districts with the percentage of Latino students who meet or exceed standards in SBAC tests, we see that the different chronic absenteeism rates explain only 21%-27% of the difference in achievement levels.
On the other hand, the same analysis conducted for districts with at least 1000 Black students shows that the varying chronic absenteeism levels explain 56%-65% of the observed variation among their achievement levels.
That the results for Latino students and Black students are so different shows how complex the topic is. Attendance matters a lot but it’s hard to quantify just how much it matters.
San Francisco
How does San Francisco Unified compare with the rest of the state? Chronic absenteeism is a longstanding issue in the city. As far back as 2003, a civil grand jury issued a report called “Tolerating Truancy, Inviting Failure: The San Francisco Unified School District Fails to Enforce Attendance”
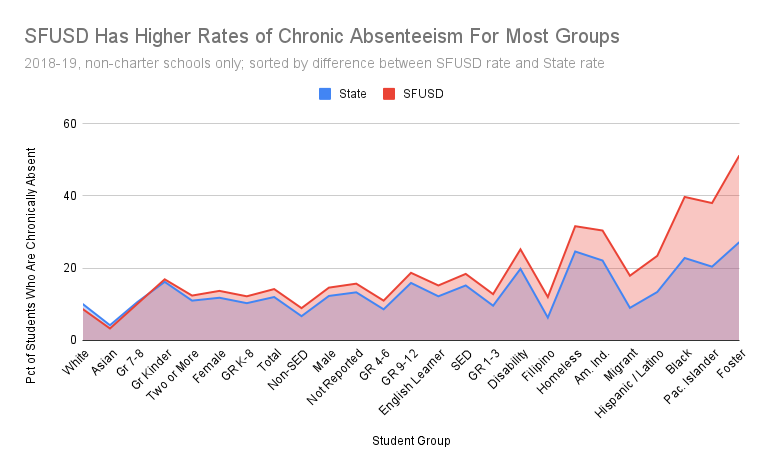
In 2018-19, SFUSD’s overall rate of chronic absenteeism was 14.2%1, a bit above the 12% statewide rate. That doesn't sound too bad but this overall number flatters SFUSD because the district has far more Asian students than most districts and, as we’ve seen, they tend to have much lower rates of chronic absenteeism. Here’s a chart comparing the chronic absenteeism rate in SFUSD with the statewide average for all the demographic groups in the CDE data.
The chart is arranged according to the difference between the SFUSD and state chronic absenteeism rates for each group. On the left-hand side, White and Asian students are slightly less likely to be chronically absent in SFUSD than elsewhere in California. There is a ready explanation for this: White students in San Francisco are far less likely to be socio-economically disadvantaged (SED) than White students elsewhere in the state and non-SED students tend to have lower chronic absenteeism rates everywhere.
On the right-hand side of the chart, Pacific Islander students and those in foster care are 86% more likely to be chronically absent in SFUSD than elsewhere in California. In fact, over half (51%) the students in foster care were chronically absent in SFUSD. The foster care system in the city must be completely broken.
Meanwhile, Latino and Black students were 75% more likely to be chronically absent in SFUSD than elsewhere in the state. For Latino students, the percentages are 13% statewide versus 23% in SFUSD. For Black students, it’s 23% statewide but 40% in SFUSD.
Latino Student Absenteeism
The 23% chronic absenteeism rate among Latino students was the third worst in the state, better than only Vallejo City (27%) and Oakland (37%). The best in the Bay Area is Fremont at 11%. Of the three high-performing districts I always compare SFUSD to, Long Beach was at 16%, ABC at 9% and Clovis at 10%. At the other extreme, Santa Maria-Bonita in Santa Barbara County has more Latino students than SFUSD but only a 5.6% chronic absenteeism rate among those students.
Black Student Absenteeism
The 40% chronic absenteeism rate among Black students was the second worst in California among districts that have at least 1000 Black students. Only Oakland had a higher rate. The Bay Area districts were generally bad: best in the Bay Area were Berkeley and Fairfield-Suisin where the rate was 20%. Districts elsewhere in the state do much better. Of the three high-performing districts I always compare SFUSD to, Long Beach was at 22% while ABC and Clovis were both at 11%. The three under 10% are Corona-Norco and Murrieta Valley, both in Riverside County, and Etiwanda Elementary in San Bernardino.
Why are the Latino and Black chronic absenteeism rates so much worse in San Francisco than in other districts? Is it the fault of the parents or the district? If you’re inclined to blame absenteeism on the parents, you have to try to explain why Latino and Black parents here can’t get their kids to school but Latino and Black parents elsewhere in the state can. If you’re inclined to blame absenteeism on the school district, you have to point out something the district is doing or not doing that leads some groups of students to miss school but not others.
This is the first of a series of posts on this topic. I’ve had to split it into multiple posts to avoid emails being truncated by gmail. The next post will examine the impact of the pandemic.
Further Reading
Attendance Works is an organization dedicated to boosting school attendance rates. Here’s their summary of all the research on why attendance matters.
The California School Dashboard has a figure of 12.2% but that is the figure for grades K-8 only. 14.2% was the K-12 rate.


I really appreciate your data driven approach to these topics.