Classified Staff
Classified staffing levels vary wildly from school to school for obscure reasons and have grown by 60% in the last decade

Many jobs in a school system require a credential. Teachers require credentials. So do counselors. And librarians. And social workers. And nurses. Many administrative positions, such as school principal, also require credentials. When I’ve written in the past about staffing levels, it’s been about teacher staffing levels. This post is about all the other employees of a school district, collectively called the classified staff.
According to the CDE, “Classified staff are employees of a school, district, or county office of education who are in a position not requiring certification. Classified staff include paraprofessionals, office/clerical staff, as well as other classified staff, such as custodians, bus drivers, and business managers.”
Paraprofessionals
Paraprofessionals are “[s]taff members who provide instructional support, including those who: (1) provide one-on-one tutoring if such tutoring is scheduled at a time when a student would not otherwise receive instruction from a teacher, (2) assist with classroom management, such as organizing instructional and other materials, (3) provide instructional assistance in a computer laboratory, (4) conduct parental involvement activities, (5) provide support in a library or media center, (6) act as a translator, or (7) provide instructional support services under the direct supervision of a teacher. Common job titles include: teaching assistants, teacher aides, bilingual aides, pupil service aides, and library aides.”
Figure 1 shows how the number of paraprofessionals varies from school to school. MTSS stands for Multi-Tiered System of Supports and is SFUSD’s imperfect mechanism for directing additional funding and staff to the neediest schools. Tier Three schools are neediest. In general, the bigger the school the more paraprofessionals it has but there is enormous variation even among schools with similar enrollment. Moreover, this variation is not explained by need. If it were, the red dots would be above the orange dots and the blue dots would be below both.
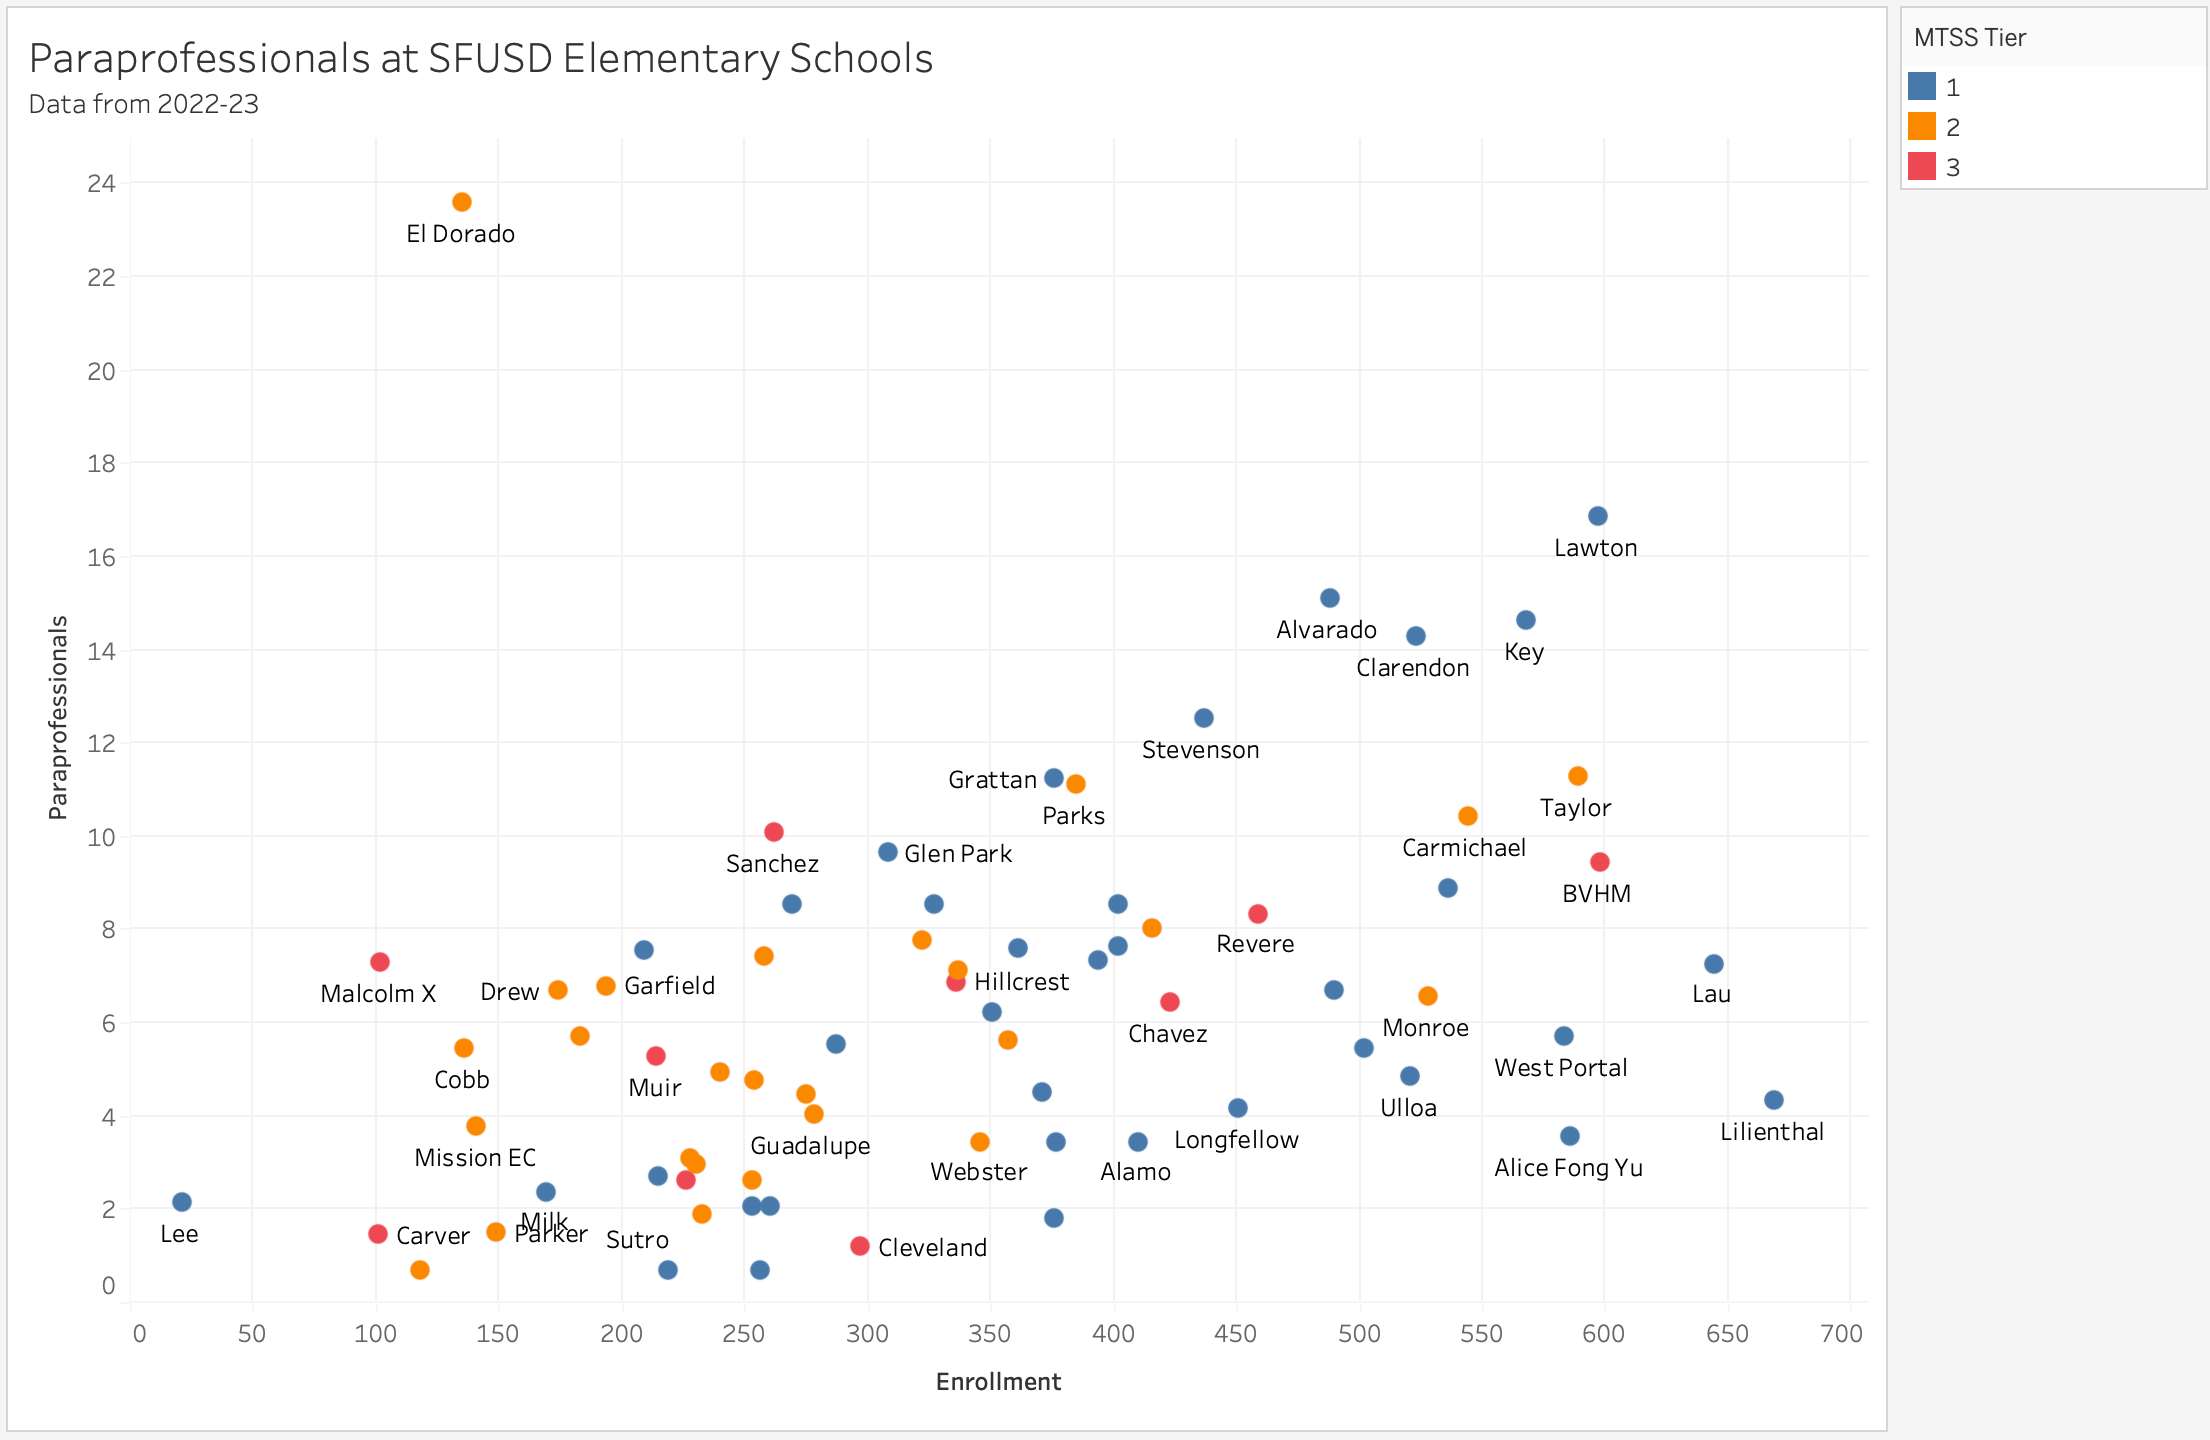
Some examples that illustrate how odd some of these staffing allocations are:
El Dorado had 23.57 paraprofessional FTEs to support its 135 students whereas Cobb, another Tier Two school, had only 5.46 to support its 136 students.
Malcolm X and Carver are two tiny (102 and 101 students, respectively) majority Black, Tier Three schools. But Malcolm X had 7.28 paraprofessionals compared to Carver’s 1.44.
Grattan and Rosa Parks both have about 380 students and 11.1 paraprofessionals. If staffing was based on need, we’d expect Parks to have more than Grattan because Grattan has the lowest percentage of FRPM-eligible (FRPM=free or reduce price meals) kids in the district (14%) whereas 54% of the students at Parks are FRPM-eligible.
Clarendon and Ulloa are two thriving (523 and 521 students respectively) Tier One schools. Only 17% of Clarendon’s students are eligible for free or reduced price meals, compared to 57% of Ulloa’s, but Clarendon has 14.27 paraprofessionals whereas Ulloa has only 4.83.
Lawton, Buena Vista-Horace Mann, and Alice Fong Yu are all K-8 schools with nearly 600 students. Lawton and Alice Fong Yu are Tier One schools and BVHM is a Tier Three school but Lawton has 16.84 paraprofessionals whereas BVHM has only 9.45 and Alice Fong Yu has only 3.57.
Office/Clerical
Office/Clerical staff “provide support to administration, business services, data processing, or support of teaching and administrative duties of the office of principal or department chairpersons. Common job titles include: administrative assistants and secretaries.”
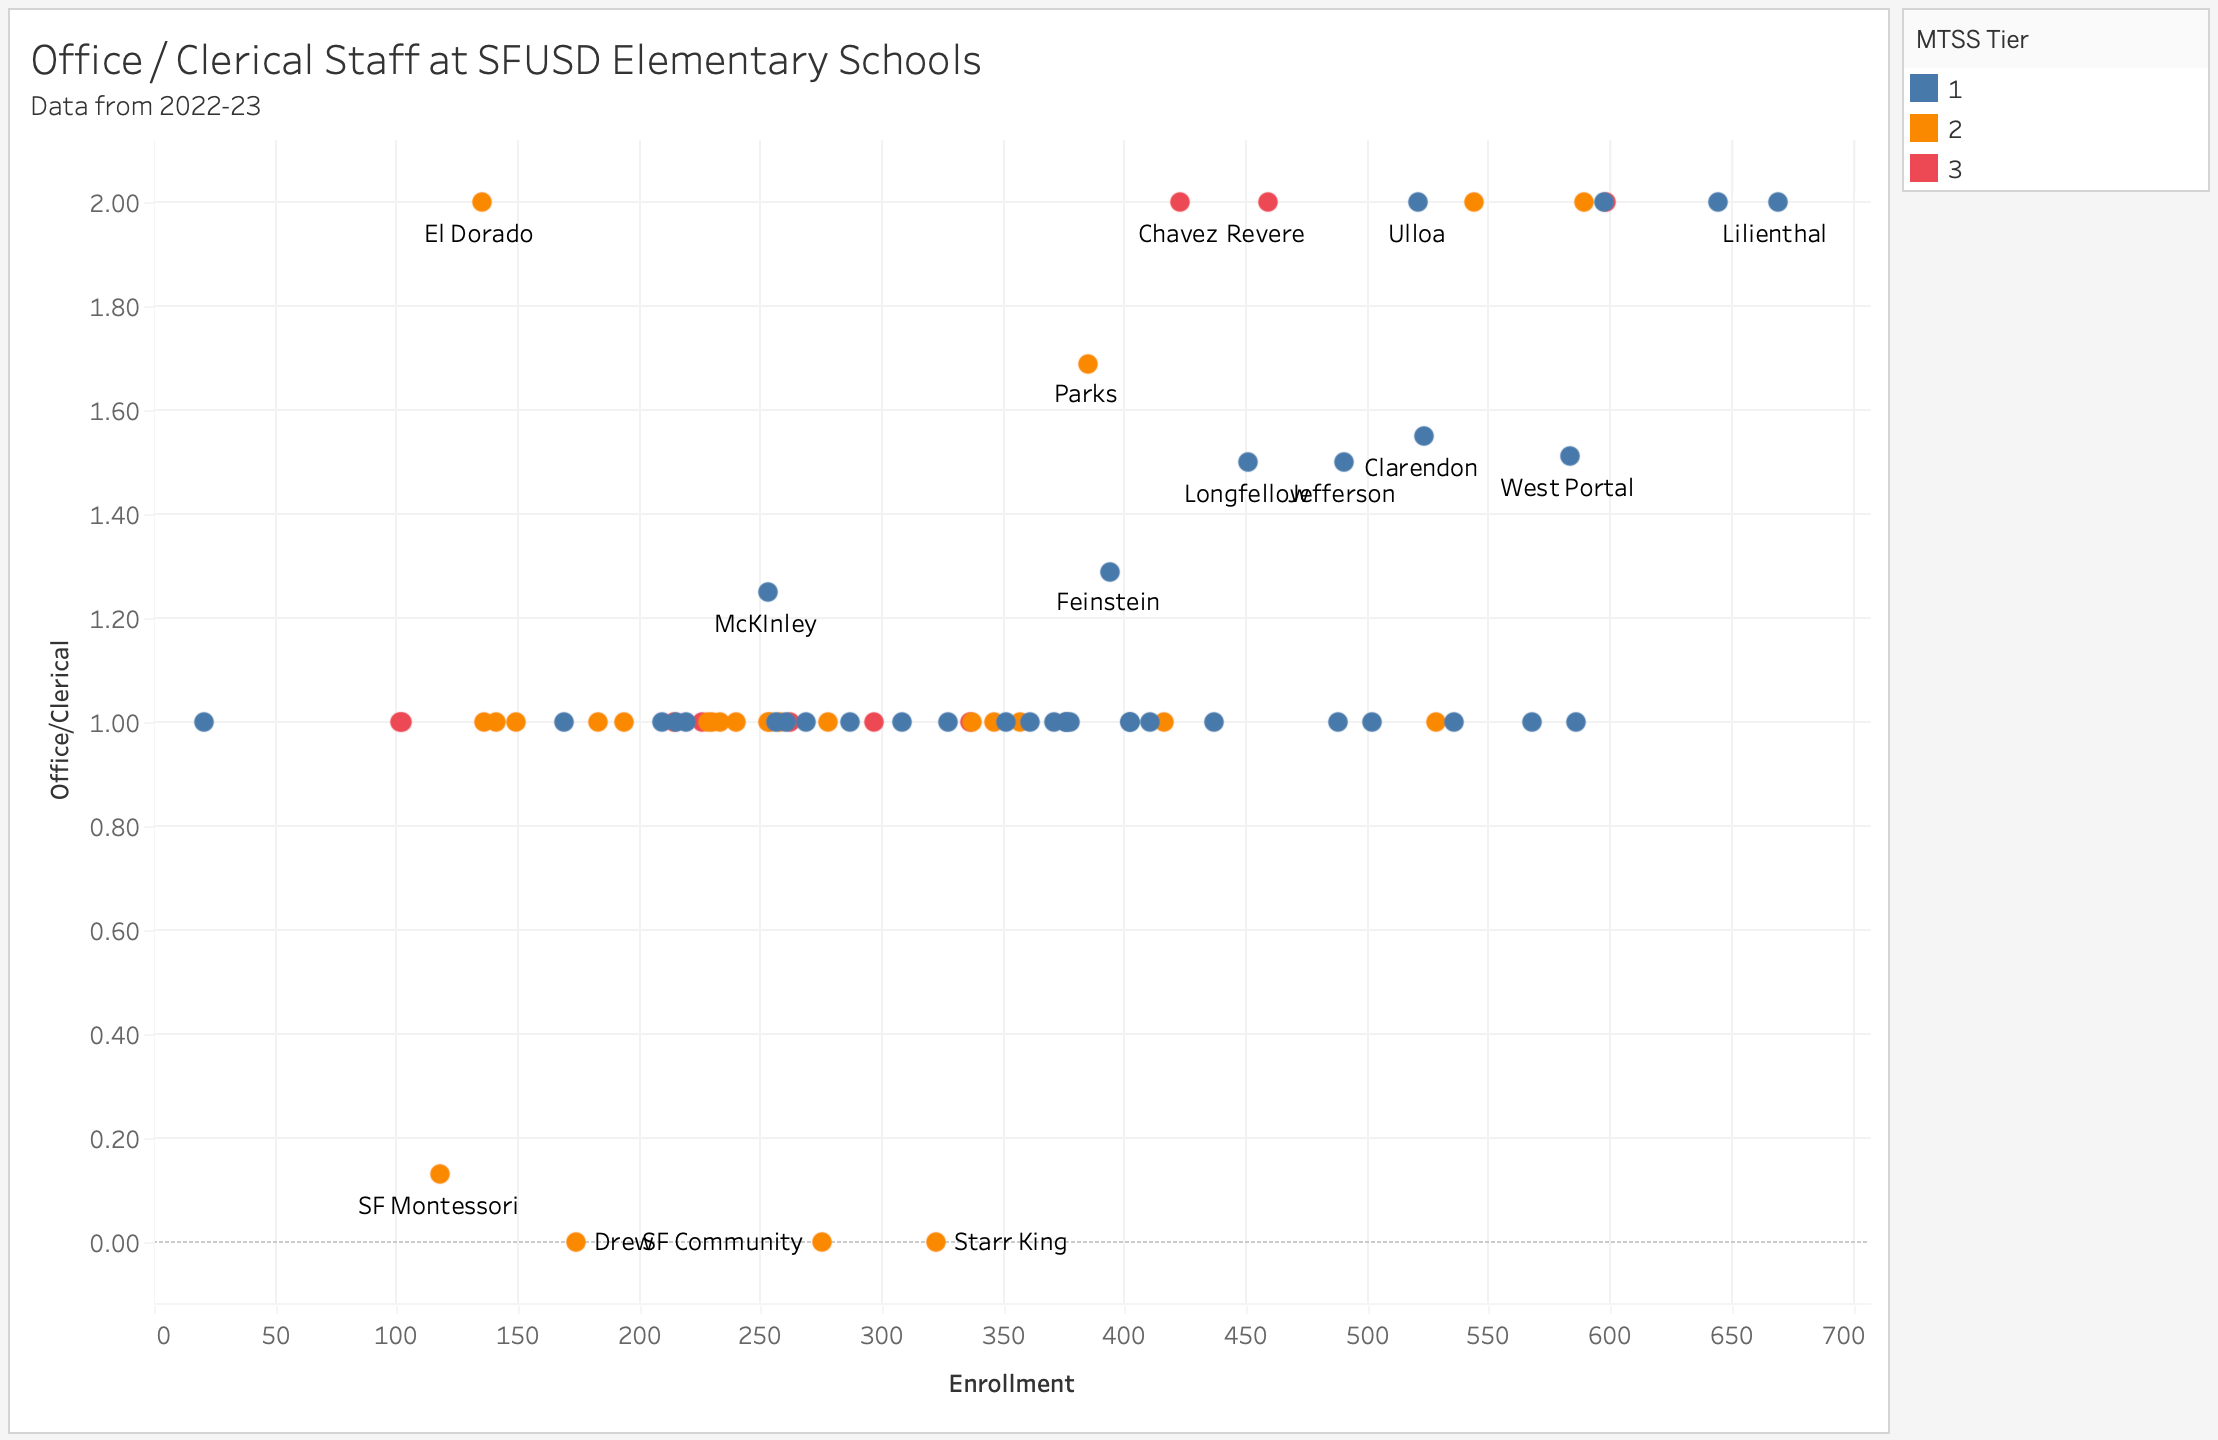
A majority of schools have exactly one Office/Clerical staff but three (Drew, SF Community, and Starr King) have zero and SF Montessori had only 0.13 FTE. I would guess (and it’s only a guess - if you have actual knowledge, please let me know) that the schools with zero office/clerical staff had an open position that they were unable to fill. Meanwhile, ten schools had two office/clerical staff. Most of those are among the larger schools but El Dorado has two even though it has only 135 students, which is fewer than any of the schools that have zero.
Other Classified
“Other Classified” staff are “support staff not reported in instructional or student support and staff below the level of assistant, deputy, or associate superintendent. Common job titles include: health services staff, plant and equipment maintenance staff, custodians, food service staff, managers, after school staff, bus drivers, security, and noon duty supervisors.”
A majority of schools have 1-4 Other Classified staff but Serra, for some reason, has 18.86 even though it has only 253 students. Even if we exclude Serra, Tier Two schools seem to have more Other Classified staff than Tier Three schools and numbers depend very little on enrollment.

Since the number of office/clerical and other classified staff varies very little with enrollment, they are part of the fixed cost of operating a school, like employing a principal, or paying for utilities. The smaller the school, the more expensive those fixed costs are on a per-student basis.
Middle Schools
Since there are fewer middle schools than elementary schools, I’m going to switch to a different type of chart that will allow me to show all three types of classified staff on one chart. Here, the y-axis is the number of classified staff per thousand students. If staffing were proportional to enrollment, all the bars would be the same height. Figure 4 shows that, in general, smaller middle schools have more classified staff per student than larger middle schools. Smaller schools also tend to be needier, as measured by their MTSS Tier, but the differences are too large to be explained by need. For example, Hoover (60% FRPM-eligible, Tier One) has 22.4 classified staff per thousand students. King (70% FRPM-eligible; Tier Three) has 47, more than twice as many.

Aptos is the big outlier, however. It is the fourth largest middle school but it has 39.27 Other Classified staff, which is more than the three largest middle schools (Giannini, Presidio, and Hoover) put together. Curiously, it is only the number of Other Classified staff that is out of line. Its number of paraprofessionals, adjusted for enrollment, is one of the lowest.
Another oddity is the staffing at Lick and Everett. These are both majority Latino schools with around 600 students and both are located just west of the Mission, in Noe Valley and the Castro respectively. But Lick has 7.25 paraprofessionals whereas Everett has 12.68. Maybe, and I’m just speculating, Everett gets extra staff because it has a newcomer program.
High Schools
The staffing pattern at high schools is shown below in figure 5. Again, there is a general trend where smaller schools have more staff on a per student basis and an argument that at least some of this may be justified by need. Nevertheless, there are peculiarities.

Asawa SOTA has 65.13 Other Classified staff, about ten times what one would expect based purely on enrollment. I’m guessing a School of the Arts needs a lot of Arts-specific staff, many of whom may not need to be certificated teachers, but that’s still a lot of people.
Mission and Burton are both Tier Two high schools with around 1,050 students, about 60% of whom are FRPM eligible. But Mission has 34.75 paraprofessionals whereas Burton has only 16.5.
Lincoln, Galileo, and Washington are three Tier One comprehensive high schools with 1,820-2,040 students. But Lincoln has 34.5 paraprofessionals whereas Washington has 24.88 and Galileo only 17.75.
Other Districts
You might be wondering how San Francisco compares with other districts. I certainly was so I did a histogram showing the classified staff employment levels in every district with at least 7,500 students. The result is shown in figure 6.

Given the number of school sites it has, all of which need classified staff in order to operate, I was shocked to see that SFUSD was far below the median. I dug a little deeper. It turns out that the data accounts for less than half the number of classified staff employed in San Francisco. The rest are employed by San Francisco County Office of Education (SFCOE), not SFUSD. Let’s take a detour into the world of County Offices of Education (COEs).
County Offices of Education
Each of California’s 58 counties has its own County Office of Education. Here’s an excerpt from Ed100’s primer on COEs:
“Most county offices … operate some education programs that provide services directly to students. Typically, these are special education programs for students with specific disabilities such as blindness or deafness, schools for students who have been expelled, and court schools for juvenile offenders.
By law, county offices have various forms of oversight over local districts and charter schools. They include:
Approve each district's annual budget and two interim financial reports.
Ensure districts' sound fiscal operation, and take specific actions if a district may not be able to meet its financial obligations.
Monitor the quality of school facilities, instructional materials, and teachers.
Support the work of the County Superintendent of Schools in reviewing and approving each district's Local Control Accountability Plan (LCAP).
County superintendents must assure that local school districts’ Local Control Accountability Plans (LCAPs) are prepared properly and that a district’s budget is sufficient to implement the improvement strategies outlined in its LCAP.”
So, Oakland Unified is supervised by Alameda County Office of Education, Burlingame Elementary is supervised by San Mateo County Office of Education, and so on. San Francisco, however, is one of seven counties that contain just one school district and it is by far the largest of those seven. The others all have fewer than 4,200 students.
Although SFUSD and SFCOE have distinct responsibilities, they are not separate organizations. They both operate out of the same building. The Superintendent of SFUSD is also the Superintendent of SFCOE. The board we elect to govern SFUSD also governs SFCOE. SFCOE does have its own budget and does operate three small schools (total enrollment: 153) but, when it comes to the oversight and monitoring aspects of the the COE’s responsibilities, SFUSD essentially supervises itself. As the old saying puts it, quis custodiet ipsos custodes?
To fulfill its functions, a COE needs staff. Just as we did with regular school districts, we can look at each COE’s staff-to-student ratio. Since a COE is serving all the students in a county, the denominator should be the number of students in all schools in the county, not just those in the small schools actually run by the COE. Here’s the chart:

San Francisco is a huge outlier. Whereas most COEs employ fewer than 10 classified staff per thousand students in the county, SFCOE employs 29.2 per thousand. In raw numbers, SFCOE employs more classified staff than SFUSD: 1,622 to 1,533.
Here’s what’s going on. In most districts, there are a lot of classified staff employed at the District Office in addition to those at school sites. Among very large unified districts (those with at least 30,000 students), the percentage of classified staff employed at the district office ranges from 21% at Corona-Norco (Riverside) to 65% at Santa Ana (Orange) with a median of 39%. SFUSD employs zero classified staff at the District Office. Instead, those staff who would normally be employed at the District Office are employed by the County Office instead. I’m not sure why they chose to do this and am a bit surprised that the SFCOE’s budget is sufficient to pay for so many classified staff but that doesn’t mean it’s wrong or nefarious. It does demonstrate how difficult it is to compare SFUSD’s budget with that of other districts because the boundary between the district’s responsibilities and the COE’s responsibilities is different here than in other districts.
Suppose that SFCOE’s staffing rate was the same as San Mateo’s (i.e. 2.2 per thousand students instead of 29.2) and the remaining classified staff moved from SFCOE to SFUSD. Then SFUSD would be employing 62.7 classified staff per thousand students, which would be the highest in the Bay Area, but almost identical to Los Angeles Unified. Scroll back up to figure 6 and imagine SFUSD where Los Angeles is.
Growth Over Time
Figure 8 shows that classified staff numbers have risen by over 1,200 (63%) since 2013-14 and by 670 (27%) since 2020-21. All of that growth has been among the “Other Classified” category (and most of it in the SFCOE District Office rather than in SFUSD schools) but no finer grained information is available on what those people do.

What could account for all that recent growth? I know that all students are now eligible to get free school lunches and those extra lunches must require some increase in staff. I suspect that most of the people working on the EmpowerSF payroll system debacle are consultants but it’s possible some are recently hired employees included in the “Other Classified” category. Beyond that, I’m out of ideas. If you know for sure, please let me know.
Notes
All the data about classified staffing comes from this CDE file. That file also powers this Dataquest report.
If you want to explore interactive versions of all these charts, you can find them in Tableau here.
Thanks again for another great breakdown, Paul! Agreeing with H Kelley below that para's can be explained in part by Special Day Classes (SDCs), which are also at Clarendon ES. Also, classified staff may also be paid through PTO/PTA fundraising, which may help explain why Tier 2/3 schools with higher need may not have more personnel on site compared to more "advantaged" schools.
Thank you for this information. I am curious if the data on the amount of Paras per school included all Para’s ( Paras assigned to Special Education students too?) if so, why was the data cross referenced with students who eligible for free lunch ( tier1,2 schools) and/ or the amount of students in the school only. If not, could you provide a part 2 ( breakdown the data for Para’s that support SpEd students too) I am asking because Grattan has SDC classes which would require more paras. Therefore, it is possible that is an explanation for the differences that you have seen in some of the schools. It is also possible that the data will remain similar, which would be helpful to bring to the attention of the district. can you please clarify?