Enrollment in San Francisco Public Schools
Asian and African American Enrollment Down; Hispanic/Latino and White Enrollment Up
Enrollment in SFUSD has dropped during the pandemic with potentially serious implications for the district’s budget. Most attention focused on the drop in kindergarten enrollment, a pattern seems to have occurred across the nation. Few seem to have noticed that, in San Francisco, 9th grade enrollment fell by more than kindergarten did.
Longer term, it is widely known that African American enrollment in San Francisco has been falling for decades. It is less well-known that Asian enrollment has been falling for twenty years and that White enrollment, after declining for decades, has staged a dramatic rebound in the last fifteen years.
Short-Term Changes
Let’s start by examining the pandemic-induced change from 2019-20 to 2020-21. School enrollment is traditionally measured on a “census day” in early October so we don’t have this year’s figures yet.
Enrollment Change by School
Here is a visualization of the enrollment change by school and grade. You can explore and try to identify patterns by clicking here or on the viz below:
The biggest enrollment declines in percentage terms were at the two schools that closed: One Purpose and Mary Booker (both charters). The two schools that exclusively serve new immigrants (Mission Education Center and Lee) saw 40%+ declines, presumably because there were fewer new immigrants. Two of the middle schools with newcomer programs (Everett, Visitacion Valley) saw 15% declines but the third, Francisco, actually increased enrollment.
Four of the five schools to add more than 30 students were charter schools (New School, Gateway High, KIPP SF College Prep and KIPP Bayview Elementary). Beyond that, there’s no obvious pattern. Among high schools for example, Lowell, Mission, Lincoln, and SOTA all lost at least 30 students while Burton, Academy, Marshall, and O’Connell all gained at least 15.
Long Term Trends
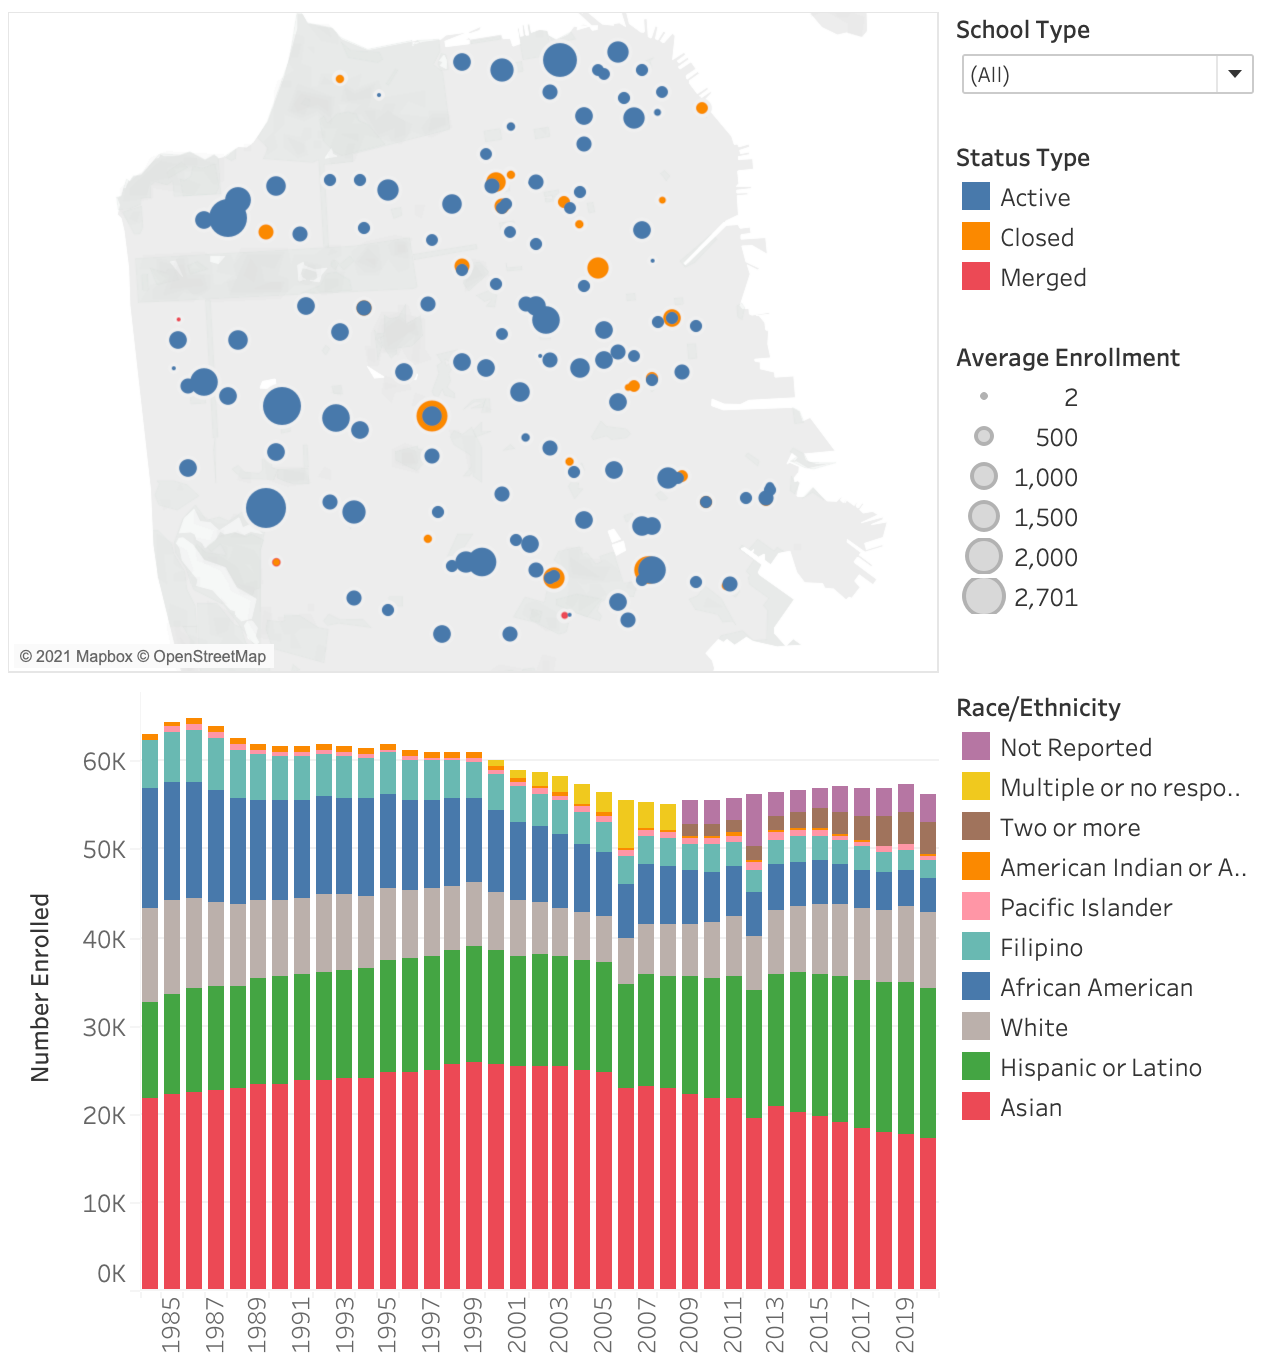
One year doesn’t make a trend. Let’s establish some perspective and look at the longer term picture. We have detailed enrollment figures going back to the 1980s. They show a slow decline in the 80s and early 90s that accelerated after 1995. Enrollment then rose slightly over the next 15 years before the pandemic caused it to decline once more. If you only consider district schools (i.e. those operated by SFUSD), the 2020-21 enrollment was a new low.
Five Keys is included in the above chart because, as a charter school network that receives its charter from SFUSD, its figures are included in the SFUSD enrollment information available from Dataquest. But their enrollment numbers should not be included in any analysis of public schooling in San Francisco because they serve a completely different population:
their focus is on people in jail or otherwise involved with the law
they primarily serve adults. In 2020-21, only 8% of students were aged 18 or under.
most of their students are not in San Francisco. Over 90% of the average daily attendance at the Five Keys Adult and Five Keys Independence schools was generated from locations outside of San Francisco county.
All the other charts and statistics below will therefore exclude the Five Keys schools.
Here is a dashboard showing the changing demographics of San Francisco schools over the past 40 years. You can look at how the enrollment at individual schools has evolved by clicking here.
Enrollment by Racial/Ethnic Subgroup
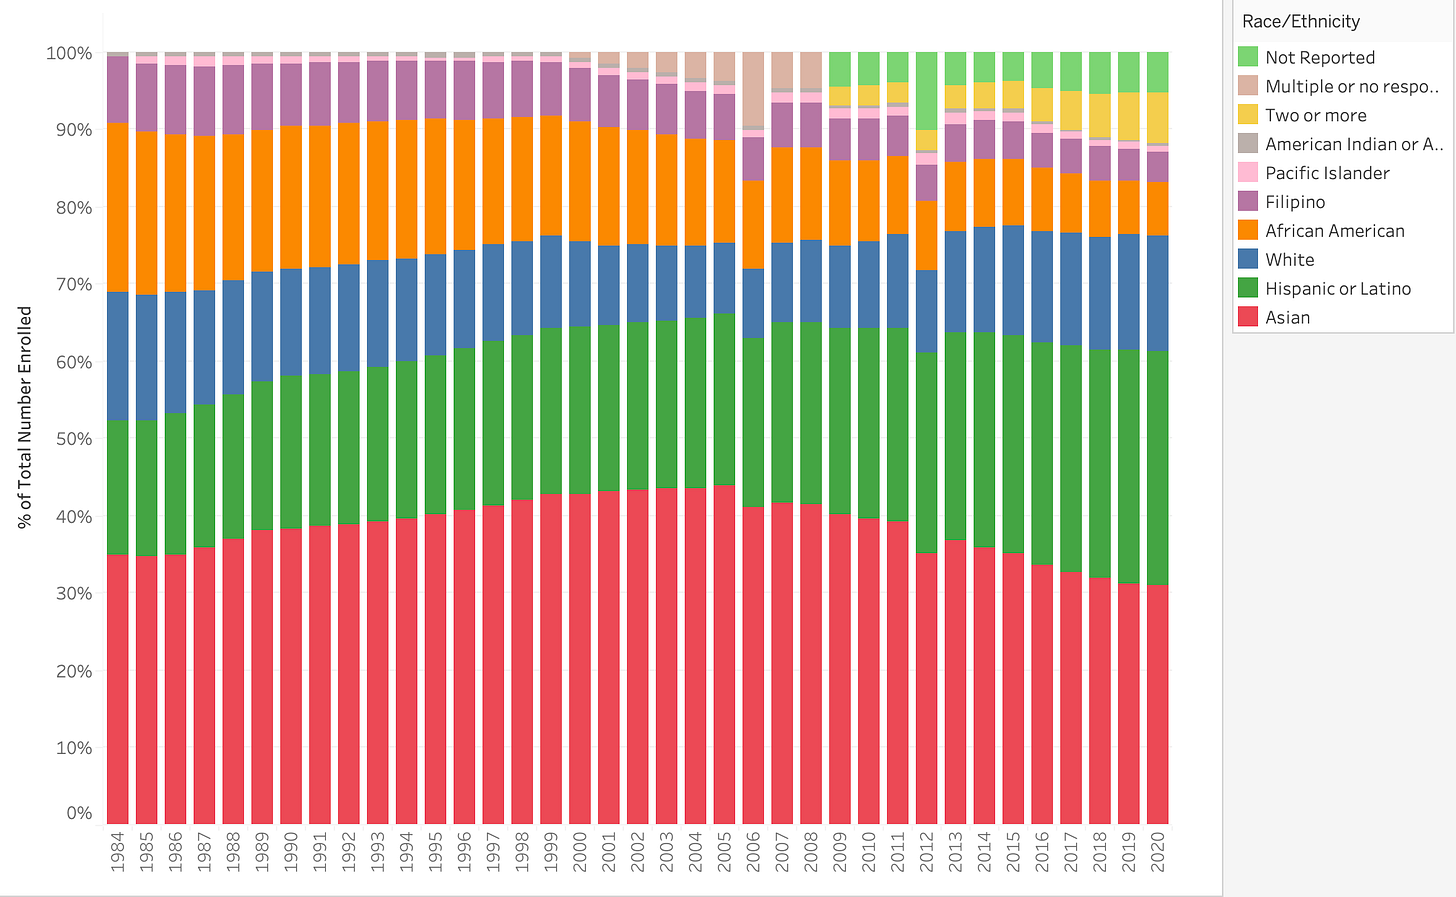
If we are not concerned about the actual number of students but only at the relative numbers from each ethnic subgroup, we end up with a chart like this:
The number of categories has changed over time. A “multiple or no response” category was introduced in 2000-01 and then split into “Not Reported” and “Two or more races, not Hispanic” in 2009-10. The obvious discontinuities in 2006 and 2012 are errors. In 2006, about 2600 students were misclassified as Multiple or No Response. In 2012, 56% of kindergartners were marked as Not Reported. This affected all groups except Hispanic/Latino students, presumably because Hispanic/Latino ethnicity is a separate question from race on the enrollment forms.
Some trends are immediately obvious. Asians comprise a smaller proportion of the student body than at any time in the last forty years. The proportion that is African American or Filipino has also been falling. In their place have come increasing numbers of Hispanic/Latinos and of Two or Mores and Not Reported.
Let’s examine this in more detail, starting by comparing the two largest groups.
Asian and Hispanic/Latino
In 1999 there were almost exactly twice as many Asian students as Hispanic/Latino students in San Francisco public schools. The number of Asian students has fallen by 33% since then and the number of Hispanic/Latino students is up by 30%. Now the difference between the two is less than 2% and Asians constitute a plurality only in high school. When the 2021-22 enrollment figures are released it will be no surprise if Hispanic/Latino students are the largest group in San Francisco public schools. However, it’ll be many more years before that’s true for SFUSD-operated schools partly because charter schools have far more Hispanic/Latino students than Asian students and partly because fewer Hispanic/Latino students are entering the school system. Consider the following chart, which shows just 1st grade enrollment this century.
Hispanic/Latino enrollment rose more than 40% between 2004 and 2012 but it peaked at that point. It has declined by 14% since then and is now only 4.4% higher than it was in 2000. It would thus be a mistake to assume that the overall number of Latinos is set to rise inexorably. Meanwhile, 1st grade Asian enrollment is down 21% since 2012 and shows no sign of bottoming out.
Multiple or No Responses
2000-01 saw the introduction of a “Multiple or No Response” category in the enrollment data. This was split into “Two or more” and “Not Reported” starting in 2009. The percentage choosing Not Reported has increased by 18% since then but the number choosing Two or More is up by a massive 178%. At the elementary school level, Two or More is now the fourth largest group and Not Reported the fifth largest, both more numerous than African Americans.
Who are the students whose race/ethnicity is Not Reported? It is likely that they are disproportionately Asian for the following reasons:
When the “Multiple or no response” category was first introduced, the Asian group saw a drop in enrollment and other groups were not significantly affected.
At the individual school level, the percentage of Not Reported students at a school correlates most closely with the percentage of Asian students at the same school
We saw earlier that the number of Asian students in San Francisco has been falling since 1999. If those with Not Reported ethnicity are indeed disproportionately Asian, this means that the decline in Asian student enrollment may be exaggerated.
It is easy to come up with hypotheses for why Asian parents might be less inclined to report a race for their children but we don’t have the data to test those hypotheses.
White and Black and Filipino
For over 20 years, African American, White, and Filipino enrollment declined at comparable rates. Between 1984 and 2006, African American enrollment fell by 54%, White enrollment by 53% and Filipino enrollment by 43%.
In the fifteen years since then, African American and Filipino enrollment has continued to decline at about the same rates. Compared with 1984, African American enrollment is down 72% and Filipino enrollment is down 59%. But White student enrollment rebounded starting in 2006. In 2010, there were more White students than Black in San Francisco public schools for the first time in decades. Today, just ten years after that crossing point, there are more than twice as many White students as Black.
Total enrollment numbers change only gradually because it takes 13 years for a student to progress from kindergarten to 12th grade. If we focus on 1st grade enrollment1, we can see that African American and Filipino enrollment continues to decline. Overall student numbers for those groups thus show no sign of rebounding.
In contrast, there are more White kindergartners now than there were at any time back in the 1980s so the number of White students in public schools is set to rise for the next few years at least.
Questions
We have looked at what has happened to enrollment but have not yet talked about why it happened. Here are some questions to ponder:
Why has the number of Asian students in public schools gone down 33% since 2000 when the Asian population in San Francisco has actually increased by about 25% since then?
Why did White enrollment in public schools decline by over 50% between 1980 and 2005 when the White population in San Francisco declined by less than 10% in the same period? Why did enrollment bounce back after 2005?
African American enrollment in public schools has declined by more than the African American population in San Francisco. On the flip side, Hispanic/Latino enrollment has increased by more than the Hispanic/Latino population in San Francisco. Why?
If your answer to these questions is “private schools,” you’re almost entirely wrong. I’ll explain why in a follow-up post.
We use 1st grade rather than kindergarten because the introduction of transitional kindergarten distorts any long-term comparison of kindergarten numbers. Those students who do TK are recorded as spending two years in kindergarten.


