SFUSD’s resource alignment task force has been given a wealth of data about the schools in the district. The common ways to evaluate and compare schools include popularity (as measured by the number of enrollment applications), enrollment trends, absenteeism, school climate surveys, and standardized test scores.
It is much rarer to talk about enrollment stability but this is also a valuable measure of school performance. Regardless of whether a school was their first or tenth choice, if parents think their child is thriving at a school they will keep the child there. If the child is not thriving, whether because of safety, cultural, or academic issues, they will seek to transfer to another school. The rate at which students transfer out of a school is thus a powerful indicator of whether a school is doing a good job.
Many transfers happen at the end of a school year and there is, curiously, no real data about this. We can compare the enrollment at a school from one year to the next. If it falls, we don’t know whether this was because the family moved outside the city or decided to transfer to another school within the city. I imagine the district tracks the number of intra-SFUSD transfers by source and destination school but it’s not part of any standard report.
What is public is data about transfers during the school year. To be precise, there is data about enrollment stability. The idea is to measure whether students complete a full year of learning in one school. In California, this is defined as 245 consecutive calendar days within the academic year, which is about 90% of a school year.
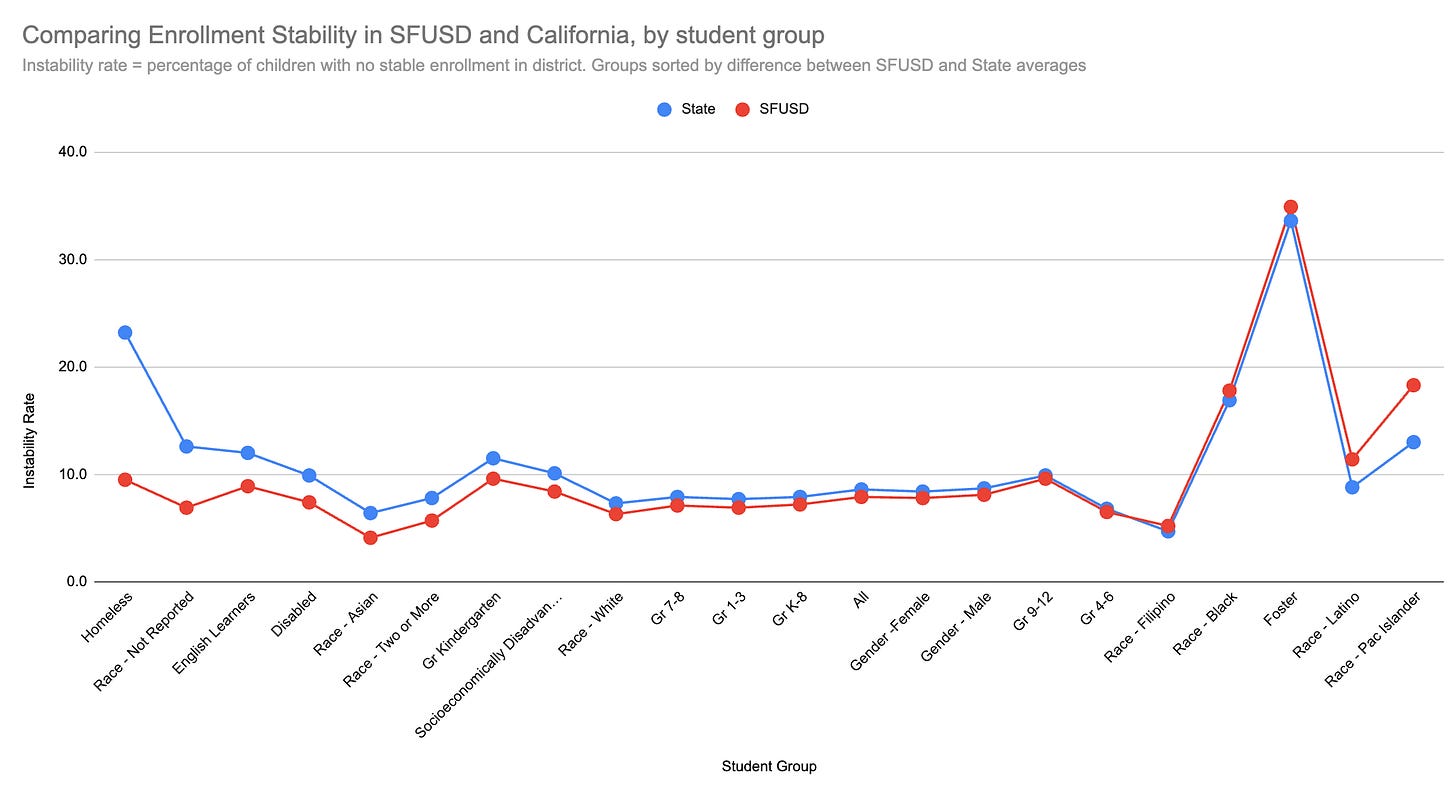
The CDE publishes counts of enrollment stability by school and district and breaks the numbers down by various student groups. Figure 1 is a comparison of the SFUSD rates for each student group with the state averages for those groups.

The first thing that surprised me about this chart is that SFUSD overall is more stable than the state average. I had assumed that cities would be inherently more unstable than suburban or rural communities but most student groups in SFUSD are at least a little bit more stable in the district than elsewhere. Latino and Pacific Islander students are the two groups that are noticeably more unstable than their counterparts statewide. The second thing that surprised me is how much more stable homeless students are in San Francisco than elsewhere in the state. Their instability rate is 23.2% across the state but only 9.5% in San Francisco. This is in marked contrast with foster care students, a full one-third of whom suffer from unstable enrollments both in SFUSD and across the state.
Stability Rates over time
The CDE has six years worth of enrollment stability data, reaching back to before the pandemic. Figure 2 shows that the percentage of students lacking stable enrollments is nearly always a bit lower in San Francisco than in the state average.

The yellow bars show the weighted average enrollment instability in SFUSD’s schools (as opposed to the district-level instability rate). In 2022-23, this averaged 10.8%, nearly 3 percentage points higher than the reported rate for the district which was 7.9%. The schools’ average is always higher than the district average because a student may have an unstable enrollment at a school but a stable enrollment within the district. Consider the scenario, which is pretty common in kindergarten and in 6th and 9th grades, where a student starts off in School A, but clears the waiting list for School B after a week, transfers to school B, and then completes the school year there. The student will be recorded as having an unstable enrollment in School A and a stable enrollment in School B. If A and B are in the same district, the student is considered stable for the district.1
School Stability Rates
If we want to compare stability rates across schools, we need to adjust for school composition because Asian students have the lowest instability rates. Without adjusting, the schools with the lowest instability rates would simply be those with the most Asian students.
Figure 3 shows the instability rate across elementary and K-8 schools for Latino students. I chose as the x-axis the share of students in the school who were Latino and we can see that this has no correlation with the instability rate at the school. Latino students can be very stable at schools with few other Latino students (e.g. Sunnyside, Grattan) and at schools with large Latino majorities (e.g. Buena Vista Horace Mann and Revere). On the other hand, there are schools where the instability rate for Latino students exceeds 20%. The single highest rate is at Mission Education Center but that’s excusable because it’s designed for newcomers. Why is the rate so high at John Muir, El Dorado, and Cobb? The rates at Spring Valley, Marshall, and Cleveland may be under 20% but those schools have so many Latino students that the raw numbers are high.

Figure 4 shows the same chart but for Asian students. It’s not your imagination that this chart shows fewer schools than the previous one: nearly 30 schools were excluded from the chart because they have fewer than 20 Asian students. The highest instability rates here are at Sunnyside, Redding, and Rosa Parks but Jefferson, Feinstein, Sutro, and Argonne each have over 130 Asian students and well above average instability rates.

The schools with the highest instability rates for Asian students are not necessarily the same as those with the highest instability rates for Latino students. In fact, as figure 5 shows, the correlation is quite weak. Nevertheless, there are a number of schools where the instability rate is well above average for both groups including Bessie Carmichael, Rosa Parks, Jean Parker, and Yick Wo. There are also schools like Argonne, Jefferson, Lakeshore, Hillcrest, Feinstein, Sunnyside, or Spring Valley where the instability rate for one group is well above average and for the other group is at or below average.

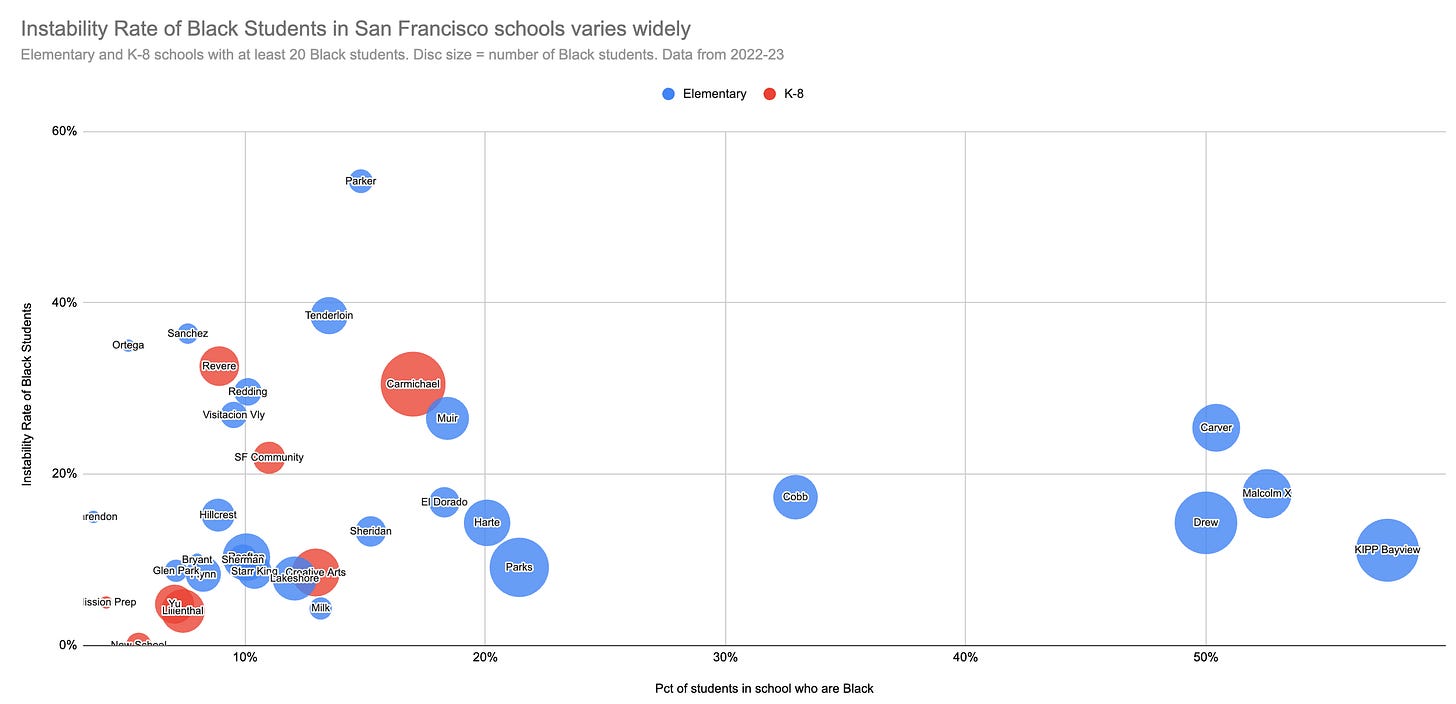
I focused on Asian and Latino students because those are by far the two largest groups in SFUSD but Black students are far more likely to have unstable enrollments (17.8%, compared to 11.4% for Latino students and 4.1% for Asian students). Figure 6 shows Black enrollment instability by school. The rates at Parker, Tenderloin, Bessie Carmichael, and John Muir far exceed those at Drew and Malcolm X, two majority Black schools.

Middle Schools
For middle schools, it’s possible to fit the data in one chart. In figure 7 (below), the schools are sorted by overall instability rate with the most stable on the left.
The numbers at Marina and Francisco are high for all groups. Otherwise, these are pretty much as I would have expected. Visitacion Valley Middle is nearly always at the bottom of these things.
High Schools
There’s much greater variability between schools at the high school level, as figure 8 shows.
Things to note:
SOTA and Gateway both have extraordinarily stable enrollments for every group.
Among the comprehensive high schools, Balboa has the lowest instability rate, better than Lincoln, Washington, Galileo, Burton, Mission, and Wallenberg.
In addition to Gateway, the other charter high schools (City Arts and KIPP) both have very low instability rates for the Latino and Black students that comprise their student populations.
Dropouts are recorded as unstable enrollments so schools with high dropout rates will tend to show high instability rates.
Independence High is an online school and I suspect its instability rate is so high because it attracts mid-year transfers from conventional high schools who might otherwise drop out. Such transfers will all be recorded as unstable enrollments even though they are transfers in not out.
Lowell
It’s interesting to dig into the Lowell numbers a little further. Figure 9 shows the data for the last six years:
In each of the four years between 2017-18 and 2020-21, the three high schools with the lowest instability rates in the state were Lowell, Gretchen Whitney High (ABC Unified) and Oxford Academy (Anaheim Union High). It’s surely not a coincidence that Whitney and Oxford are selective schools. SFUSD moved to a lottery-based admissions system in 2021-22 and saw its instability rate shoot up. Nearly every school has an increase in instability coming out of the pandemic but Oxford and Whitney rose to 1.7% and 2.1% respectively, while Lowell rose to 5.5%.
Anecdotally, lots of students who were admitted to Lowell in the lottery transferred out after the start of the school year when they realized they were not academically prepared to succeed there. These transfers out were disproportionately Black and Latino.
I compared the average school instability rate and the district instability rate in each of the 27 unified school districts with more than 30,000 students. The difference between the two averages 2.2% with a range of 0.8% (San Ramon Valley) to 4.5% (Fresno). The difference in San Francisco, at 2.9%, is thus a bit higher than the average but nothing to get excited about.


