

Excess Capacity in SFUSD's schools
SFUSD's Facilities Master Plan understates the capacity of the district's schools
SFUSD’s fiscal babysitter, Elliot Duchon, gave the board last month a list of four areas in which “the district must take action”:
Aligning schools and programs to enrollment and revenue projections
Establishing accurate enrollment projections and closely monitor enrollment
Examining staffing to align with enrollment
Document business practices and procedures
Given our declining enrollment, “aligning” means “reducing”. Any discussions about “aligning” need to be informed by data about how many students SFUSD’s schools could support if all were at capacity. What is that capacity? Well, we have three different estimates, each produced by an authoritative source:
SFUSD, in the recently completed Facilities Master Plan (FMF; see pages 74-79), gives the “enrollment capacity” of each school.
SFUSD, in an internal analysis completed in 2020, calculated the “capacity” of its schools, and gave the numbers to demographers who were forecasting SFUSD’s future building needs. Page 7 of this presentation gives the capacity of many, but not all, of the elementary schools. For some schools, the capacity figures have dropped dramatically in the intervening three years.
SFUSD, which actually enrolled students in those schools and thus should know exactly how many students it can fit in them. The maximum number of students a school has enrolled this century should provide a lower bound on its capacity.1
Which SFUSD should we trust? These three sources give dramatically different estimates of the capacity of some schools.
Elementary
Alamo ES (Richmond) has a capacity of 413 according to the new FMF but the reported capacity was 539 in 2020 and the school enrolled as many as 699 in 2004.
Carver ES (Bayview) has a capacity of only 139 according to the new FMF, down from the 308 that was reported in 2020. It enrolled 370 students in 2000 and it exceeded the 139 number as recently as 2018.
El Dorado ES (Mission) has a capacity of 184 according to the new FMF but the capacity was reported to be 308 in 2020. Its highest enrollment this century was 349 in 2001 and it exceeded the 184 number as recently as 2017.
Hillcrest ES (Portola) has a capacity of 361 according to the new FMF but the reported capacity was 568 in 2020. The highest enrollment this century was 507 in 2001.
Feinstein ES (Sunset) was constructed in 2006. Its capacity is only 421 according to the new FMF, but it exceeded that capacity every year until 2020. Its capacity was reported to be 527 in 2020 and its highest reported enrollment was 517 in 2012.
Lakeshore ES (near Lake Merced) has a capacity of 426 according to the FMF, down from the 536 that was reported in 2020 and from the 587 that it enrolled back in 2001.
Visitation Valley ES has a reported capacity of 343 according to the new FMF, over 200 fewer than the 550 which was its reported capacity in 2020. Its highest enrollment this century was 469 in 2012 and it last exceeded the 343 number in 2017.
Middle Schools
Hoover MS (Sunset) has a reported capacity of 965 but it enrolled 1,303 back in 2005 and it exceeded 965 as recently as 2020.
Marina MS has a reported capacity of 739 but it enrolled 1,068 back in 2005 and it exceeded 739 as recently as 2020.
Presidio MS (Richmond) has a reported capacity of 1,015 but it enrolled 1,219 back in 2007 and it exceeded 1,015 as recently as 2020.
Aptos MS (Ingleside) has a reported capacity of 904 but it enrolled 1,085 back in 2013 and it exceeded 904 as recently as 2020.
High Schools
Burton HS (Visitation Valley/Portola) has a reported capacity of 1,228 but it enrolled 1,904 back in 2003 and it last exceeded 1,228 in 2006.
Galileo HS (North Beach). has a reported capacity of 1,942 but it enrolled 2,237 back in 2007 and it last exceeded 1,942 in 2012.
Washington HS (Richmond) has a reported capacity of 2,101 but it enrolled 2,398 back in 2008 and it last exceeded 2,101 in 2011.
O’Connell HS (Mission) has a reported capacity of 583 but it enrolled 932 in 2004 and it last exceeded 583 in 2010.
Marshall HS (Bayview) has a reported capacity of 638 but it enrolled 1,150 in 2002 and it last exceeded 638 in 2010.
I guess that these wildly varying numbers could be caused by different definitions of “capacity”. It’s not simply a matter of figuring out how many desks you can cram into a room. There are quite a few nuances to take into account, even at the elementary school level.
Do you take staffing into account? In the last couple of years, SFUSD has reduced the number of kindergarten classes at certain schools. For example, Feinstein ES went from four kindergarten classes to three. What is the capacity of the classroom that was previously used but is now empty? Is it zero or is it still 22?
Do you take policy choices into account? San Francisco caps K-3 class sizes at 22 students and grades 4-5 classrooms at 33 students. That means that the capacity of a classroom will vary depending on which grade is using it. A classroom might have a capacity of 22 if used by 3rd graders and 33 if used by 4th graders. Policy choices can change. San Francisco’s K-3 size cap of 22 is among the lowest in the state. If the district were to decide for budgetary reasons to raise K-3 cap size to 24, this would suddenly increase the capacity of each classroom and school.
Most of the elementary schools that show the biggest capacity difference between 2020 and 2023 are those, like Feinstein, where the district has chosen to staff fewer kindergarten classes. That leads me to suspect that the Facilities Master Plan is taking staffing into account and, if so, this is a mistake. It’s true that, from a staffing perspective, the district needs to know that it has enough teachers in enough classrooms to accommodate the expected student numbers e.g. it needs to know that Feinstein is staffed for 66 kindergartners. But from a facilities planning perspective, the kindergarten capacity of Feinstein is 88, not 66. If the district had a sudden influx of students, it could put a teacher in the now-empty classroom at a negligible marginal facilities cost. The “capacity” numbers in the facilities plan should be the number the district could serve before needing to construct new schools or expand existing ones.
Measuring Excess Capacity
Since the Facilities Master Plan doesn’t accurate measure the district’s enrollment capacity, we’ll look to the actual enrollment history. We’ll estimate the capacity of a school to be the maximum number of students it has enrolled in any year since 2000. We need to go back roughly that far because the district enrolled far more students in the early 2000s than it does today. There have been no policy changes during the period that affected the capacity (we know this because the perennially popular elementary schools that are the first to fill up every year have had about the same number of students every year e.g. Rooftop’s enrollment was between 563 and 593 every year from 2000 to 2020). Looking at the maximum enrollment this century will still produce an underestimate because it’s likely that some schools have never been at capacity in any year but it’ll still be more accurate than the Facilities number.
The maximum enrollment at each individual school since 2000 sums up to 62,089. The Facilities Master Plan claims that the capacity of the same schools is only 54,062. The actual enrollment is just over 49,000. Figure 1 shows the excess capacity by school type for these two measures of capacity.

Some excess capacity is needed: every class is not full to capacity and the district needs space to accommodate arrivals during the school year. Nevertheless, the district has space for 25% more students than it has and that is probably too much capacity.
Figure 2 shows the excess capacity (the difference between the highest enrollment this century and the current enrollment) at each of the district’s K-5 and K-8 schools. Schools whose current enrollment equals their max (e.g. Ulloa in the Outer Sunset) are barely visible. Over the last 20 years the district’s enrollment is down about 15%. Schools in red are down more than 15%; schools in green are down less than 15%.
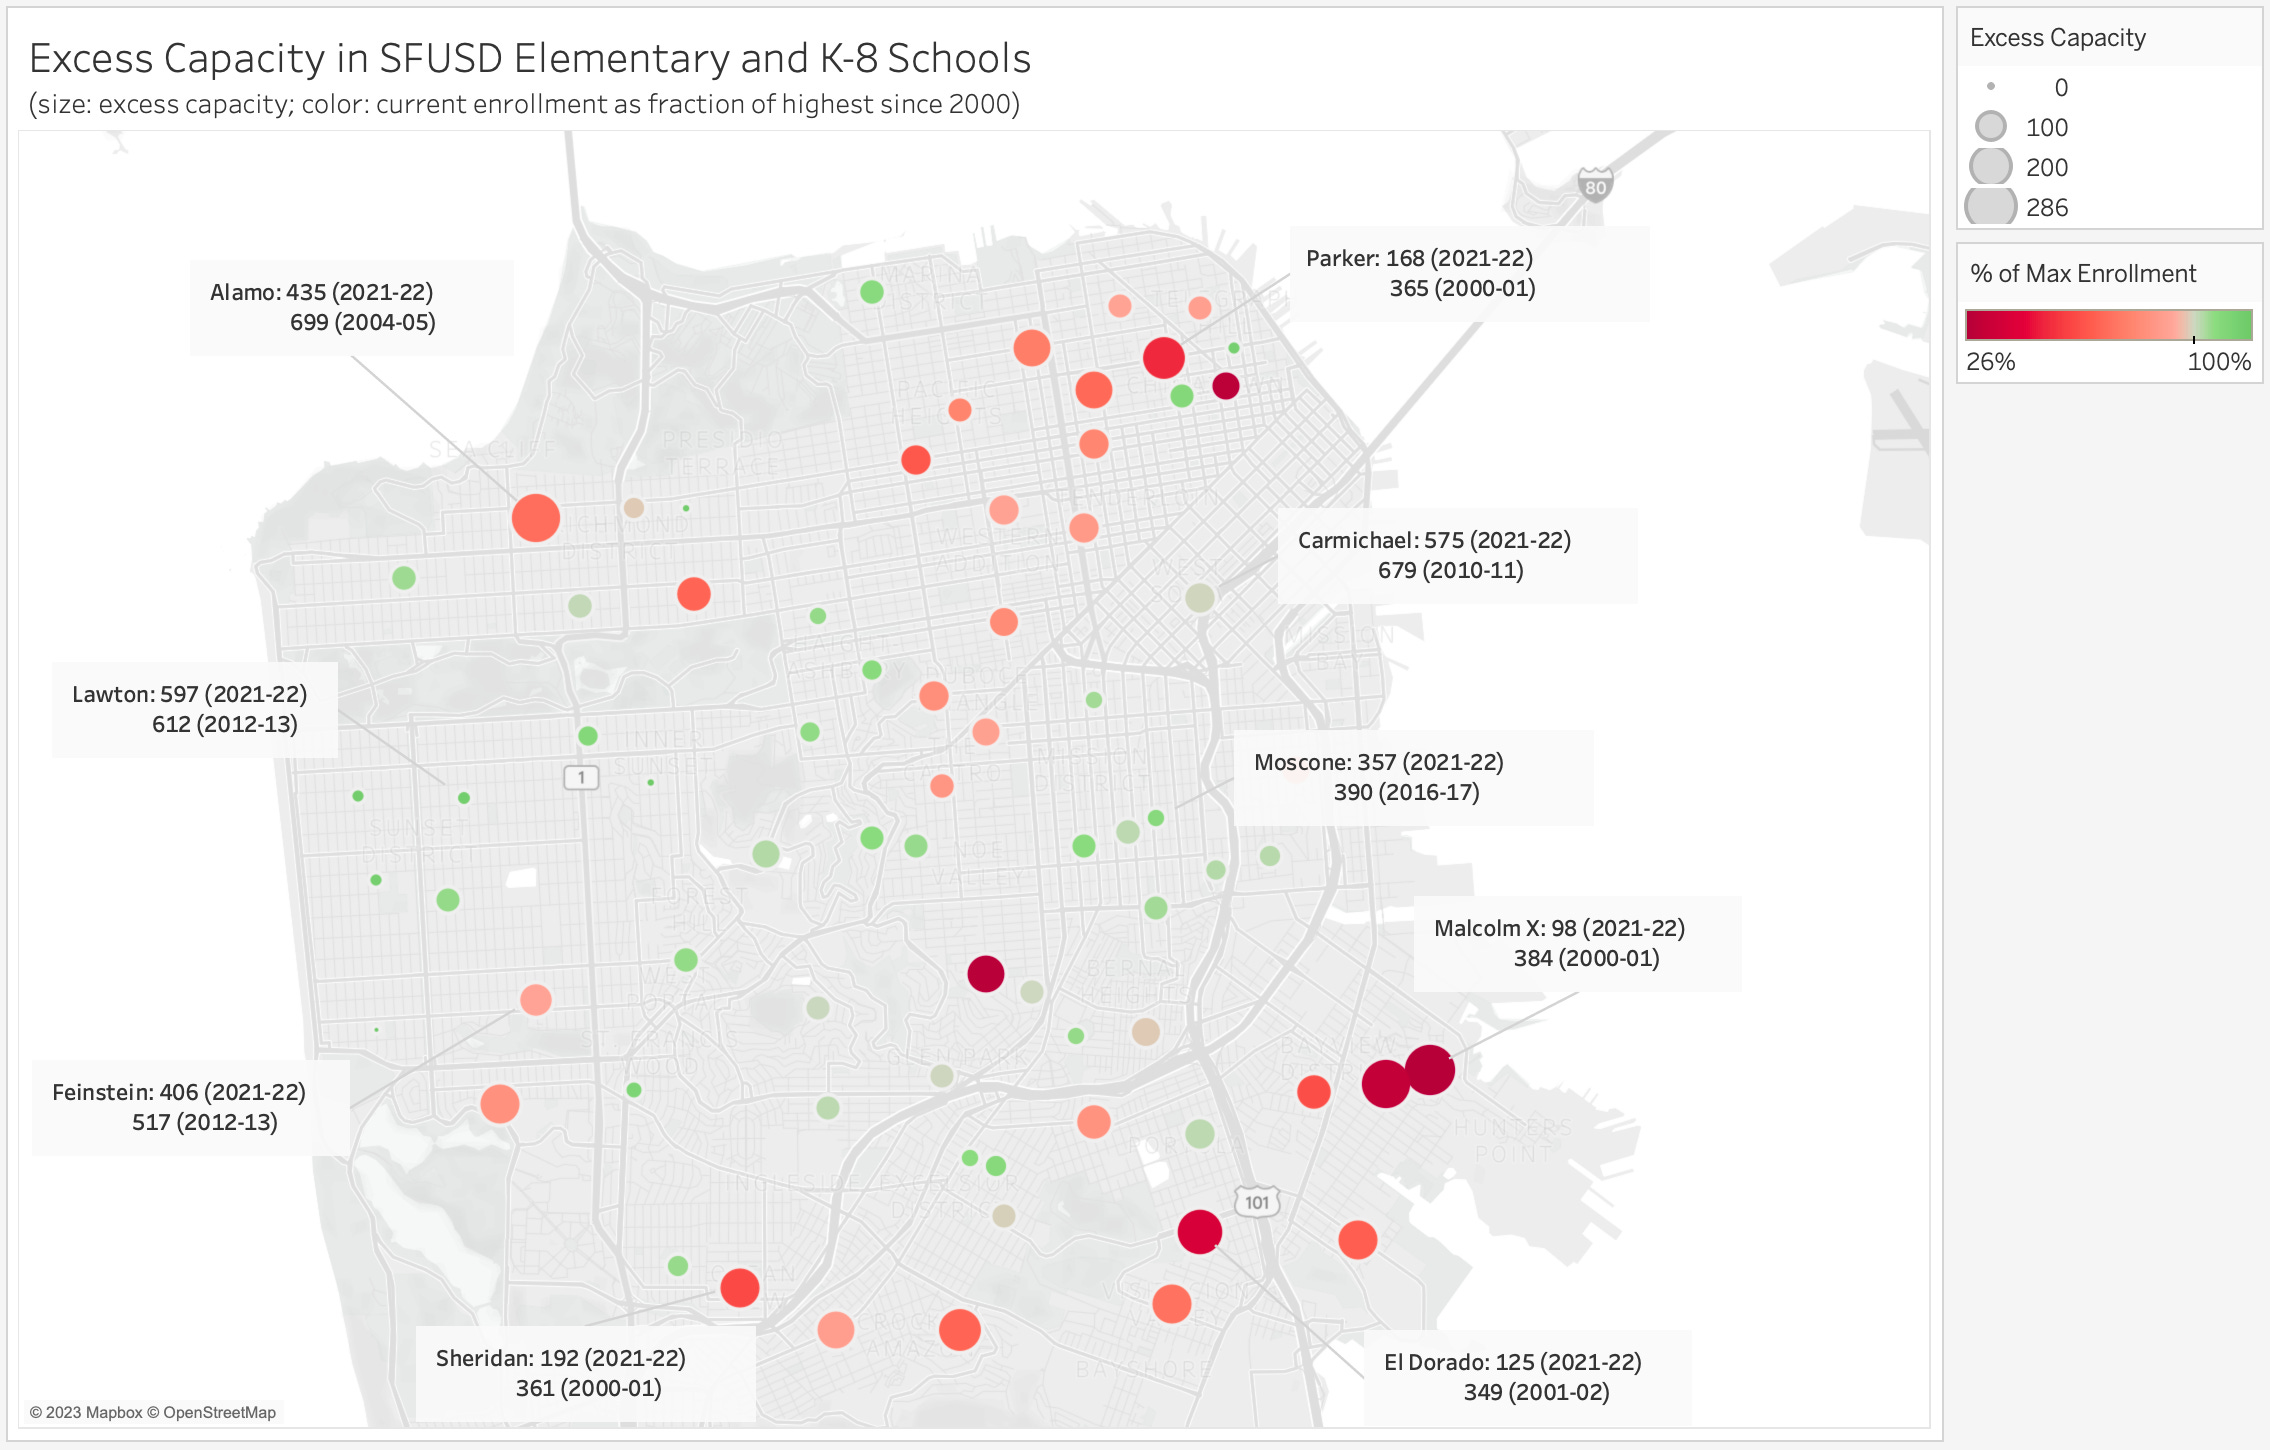
The schools in the middle of the city, from the sunset in the west to the Mission in the east, have lost far fewer students, both in absolute and percentage terms than the schools in the south and north of the city.
Conclusion
“Aligning schools…to enrollment,” as Duchon says SFUSD must do, is always a controversial process in every district. There is no sign that SFUSD is preparing the ground to undertake such a step, which is perhaps understandable given that it’s in the middle of contract negotiations with UESF, the payroll debacle is not yet resolved, and much of the senior leadership has turned over.
But the district should not back, and the voters should not fund, a facilities master plan that calls for keeping all 120 school sites open. They are not all needed and many of them require extraordinary levels of investment on a per-student basis.
I don’t want to make it seem that the district has done nothing to align staffing to enrollment. As already mentioned, they have reduced the size of the entering kindergarten, 6th grade, and 9th grade classes at certain schools. The next big post will examine those steps and, a very much related matter, the planned growth of Transitional Kindergarten.
At times of high growth in student numbers, the maximum enrollment might be higher than the capacity because a district might be forced to cram more students into a classroom than the classroom was designed to serve. That hasn’t been an issue in San Francisco for sixty years.
One interpretation of the excess capacity is that the district has failed to provide adequate public schools and so the parents have gone private. SF K enrollment dropped by 50% one year during COVID among white parents, who disproportionately held both a dissatisfaction motive (being framed as white supremacists by the school board) and the financial ability to make the move.
Many school districts across the nation are recently under-enrolled. Hired-gun demographers working to make the case for closures say birth rates are declining (but they neglect to note the COVID bump). We looked, and we found the lost children - they're playing polo with Tarquin and Peregrine at private schools.
https://stuart-reynolds.medium.com/bellevue-where-have-all-the-children-gone-4bcc0041f3a9