Explaining Student Population Trends
Why SFUSD enrollment changes don't match SF population changes
In a previous post, I raised some questions about trends in SFUSD’s student population.
Why has the Asian population in SFUSD gone down since 2000 while the overall Asian population in San Francisco has gone up?
Why did the White population in SFUSD decline so much faster than the White population in San Francisco? And why has it bounced back since 2006?
Why has the African American population in SFUSD declined so much faster than the African American population in the city as a whole?
All of these trends can be explained by the changing age profile of San Francisco residents. We are becoming a city for adults.
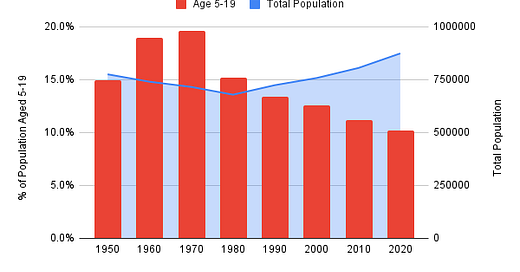
Here’s a graph showing the total population of San Francisco and the proportion that is aged 5-19.
Although the total population has grown steadily since 1980, the growth is due primarily to adults moving to the city. The proportion that is aged 5-19 continues to fall. This has affected all groups. The White community has by far the lowest percentage of kids but its percentage is the only one ticking up.
Let’s look at each group in turn.
Asian
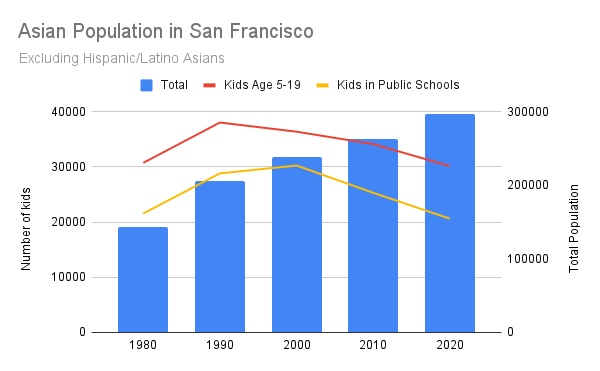
The Asian population of San Francisco has more than doubled between 1980 and today. But the percentage who are aged between 5 and 19, and thus eligible to go to school, has fallen from 21% to 10%. Consequently, the number of school-aged Asian children, which grew steadily in the 1980s and 90s, is lower now than it was in 1980. Asian enrollment in SFUSD has followed exactly the same path.
African American
The African American population has also gotten older on average. Back in 1980, 24% were aged between 5 and 19. Now that age group is only 13% of the Black population.
The total African American population has fallen by nearly 50% in 40 years but the changing age profile of that population means that African American numbers in SFUSD are down nearly 70%.
It is noticeable that the red and yellow lines are getting closer together. There are several possible explanations:
The census estimated that 15%, 15.5% and 10% of Black students in San Francisco attended private school in 1980, 1990, and 2000 respectively. It is possible that this percentage has gone down further. The census no longer publishes estimates for private school enrollment by race so we can’t be sure.
It could represent a reduction in dropout rates.
Hispanic/Latino
The Hispanic/Latino population in San Francisco has grown by 60% over the last 40 years and the number of Hispanic/Latino kids in public school has grown by over 70% over the same time. That would be unsurprising were it not the fact that the declining birth rate means the number of Hispanic/Latino kids aged 5-19 has grown by only about 12%. Where did all the extra public school students come from?
I can think of a couple of possible explanations:
As Catholic schools have closed, more Hispanic/Latino kids are switching to public schools. There’s some evidence for this. The 1980 census showed 29% of “Spanish origin persons” attending private school. By the 2000 census, only 16% of Hispanic or Latino kids were attending private school. It’s reasonable to assume that this number is even lower now because the number of Catholic schools in the city has shrunk further since 2000. But it’s only an assumption because the census bureau has not published any more recent data on this topic.
Hispanic/Latino kids are not dropping out of school as early or as often. There’s evidence for this too. If we compare the number of students in grade 12 with the number in grade 1 11 years before, we find that this percentage has increased over time. But, without longitudinal data, it’s impossible to know whether this is just a reflection of kids moving in to SFUSD from Catholic schools or whether it represents a true improvement in the dropout rate.
White
The 1980s marked the end of the White flight phenomenon. The White population in the city pretty much stagnated for the next two decades before rising in the 2010s for the first time since the 1940s. It was a modest 3% increase but combined with an increase in the proportion that were of school age, it led to near 20% rise in the population aged 5-19. That’s still significantly less than the 40% rise in the number of White students in public schools.
The gap between the red and yellow lines is much higher in this chart than in the preceding ones because a much greater proportion of White students attend private schools.
Methodology Notes
Population figures come from the U.S. Census Bureau’s decennial census. I chose to use the age 5-19 measure because the census only provides age by race breakdowns in five-year groups (e.g. 5-9, 10-14, 15-19). For 2020, even that is not available - only a U18 figure has been published so far for each race/ethnicity. To estimate a 5-19 figure, I assumed that the U18 : 5-19 ratio was the same as it had been in 2010.
The California Department of Education (CDE) does not distinguish between race and ethnicity: a person can be White or Hispanic/Latino but cannot be both. The census bureau, by contrast, recognizes race and ethnicity as separate attributes: Hispanics/Latinos can and do come from any race. To be able to compare census and CDE numbers, we have estimate census numbers for the non-Hispanic/Latino members of each race. Some calculation is required. The census tells us the total numbers in each race/ethnicity combination but does not usually provide the age breakdown for each combination. For example, the 1980 census tells us the number of “Black Persons” aged 5 to 9 and the number of “Spanish origin persons” aged 5 to 9 and the total number of Black persons of Spanish origin but not the number of Black persons of Spanish origin aged 5 to 9 or (the number we need) the number of Black persons not of Spanish origin aged 5 to 9. In such cases, I made the assumption that the age profile of Hispanic/Latinos was the same regardless of race. In other words, I assumed that the percentage of Black Hispanic/Latinos who were aged 5-9 was the same as the percentage of White Hispanic/Latinos who were aged 5-9 and not the same as the percentage of non-Hispanic/Latino Blacks who were aged 5-9.
The census bureau counts Filiponos as Asians. I therefore included Filipino students in the count of Asian students in public schools.
The CDE provides school enrollment statistics by race/ethnicity back to 1981-82 but only aggregate enrollment figures for earlier years. I assumed that the race/ethnicity breakdown in 1979-80 was the same as that in 1981-82 and adjusted for the difference in aggregate enrollment between those two years.


