
Fuzzy Math on Payday Loans
Fuzzy Math on Payday Loans
Does UESF really believe attendance has recovered?
UESF recently released “Payday Loans and Pumpkin Patches”, a report criticizing various instances of mismanagement at SFUSD down the years. Apart from having a great title, it gets several things right: the payroll debacle is inexcusable; the district’s administrative costs are too high; it fails to take advantage of its real estate portfolio. Unfortunately, the report makes a few simple numerical mistakes that leaped off the page to me when I read the report. One of these mistakes leads the report to make statements which are untrue and, I hope, not reflective of what union leadership really believes.
Let’s start with the most troubling error.
Attendance
The report says:
The school district’s average daily attendance (ADA), which is used to calculate funding from the state level has remained mainly static since the 2009-10 school year. There was a big drop in 2021-22, but according to SFUSD’s most recent financial statements, ADA appears to be increasing, bringing it close to what it was in 2009.

The numbers showing stable attendance during the 2010s followed by a big drop in 2021-22 are all correct. But the 48,332 number for 2022-23 is wrong, as should be obvious to anyone who has been paying attention to SFUSD. If actual attendance had indeed risen by more than 3,500 compared to the previous year, the district would have been celebrating and loudly touting the news. Teachers would have been reporting full classrooms. There would have been “Crisis Over” headlines. We would have heard about it.
To be fair, the author didn’t pull the number out of thin air. It comes from the district’s unaudited 2021-22 financial statements. Here’s the relevant page.

In the “2022-23 Budget” half of the table, there are three columns: “estimated P-2 ADA”, “estimated annual ADA”, and “Estimated Funded ADA.” The report uses the 48,332 number from the “Estimated Funded ADA” column. That’s just the wrong number to use. It should have used the Estimated Annual ADA. It would have been even better to use an official number from the CDE as the source. By the time the report was published, the actual 2022-23 P-2 ADA was available and showed 44,825. In other words, there was no bounce back in attendance.
What’s the problem with Funded ADA?
The choice to use the Funded ADA reveals a lack of understanding about how education funding works.
Actual funding to schools is determined by the principal apportionment from the CDE. Principal apportionment reports determine how much each district receives in state funding and exactly when the money will flow. A district’s ADA is a key input into these calculations. Each step of the calculations is documented and made public on the CDE website. Districts measure attendance daily but they are required to report it three times a year. P-1 ADA is the average from the start of the school year through December 31. P-2 ADA is the average from the start of the school year through “the last school month ending on or before April 15.” Annual ADA, as the name suggests, covers the full school year. P-2 ADA has traditionally been the most important one for funding.
Prior to the pandemic, district were funded based on the greater of the current or prior year’s ADA. If attendance was increasing, districts got the extra money immediately. If attendance was falling, districts continued to get funded based on the prior year’s attendance which meant they weren’t forced to make mid-year budget cuts.
During the pandemic, the state adopted a “hold harmless” approach. Districts were funded essentially as if their enrollment was unchanged. In 2021-22, when schools reopened, actual attendance was 46,6051 but the Total District LCFF Base Grant ADA (i.e. the rate at which the district was funded) was 50,239.
As we emerged from the pandemic, most districts continued to experience significant declines in enrollment. To give districts time to adjust their budgets to the declining enrollment, the legislature amended the law so that districts are funded based on the greater of the current year ADA or the average of the three prior year’s ADAs. Funding in 2022-23 was thus based on the greater of 2022-23 ADA or the average of the 2019-20, 2020-21, and 2021-22 ADAs.
San Francisco’s 2022-23 P-2 ADA was 44,825, up a little from the 2021-22 P-2 ADA of 44,617 but less than the 45,227 it had estimated in the unaudited financials and less than the 2021-22 Annual ADA of 46,605. Fortunately, the ADAs in 2019-20 and 2020-21 (thanks to the hold harmless policy) were over 50,000 so the average of those two good years and the down year in 2021-22 was higher than the down year in 2022-23. The district’s Total District LCFF Base Grant ADA (i.e. funded ADA) was 49,043, significantly above the 48,332 that was estimated in the unaudited financials.
Now, consider what’s going to happen in the next two years. In 2023-24, the funding will be based on two down years (2022-23 and 2021-22) and one good year (2020-21). Even if actual attendance this year is the same as last year, funded attendance will fall because the three year average will lose one of the good years. In 2024-25, absent any change in the law, there will be no good years included in the average and the district will see its funded ADA drop to something in the 45,000 range, close to a 10% drop from where it was pre-pandemic. The district will need to take significant action to adjust to the cut.
That’s why I said at the top that I hoped the report was not reflective of what UESF leadership believes. If the leadership believes that enrollment has recovered, and that state funding is not going to fall, it’s going to make it almost impossible to reach agreement with a district that is expecting funding to fall and debating what to do in response.
Enrollment
On the very next page of the UESF report, we find this statement:
While ADA has remained relatively consistent, enrollment has been declining over the past few years. At its highest, SFUSD enrolled 61,031 students in the 2019-20 academic year. In 2022-23, enrollment dropped to 55,537 students, a 9 percent decrease from its peak in 2019-20.
The percentage decrease is correct but the enrollment numbers are wrong. Again, it should be obvious that they’re wrong just by comparing them to the attendance numbers. The report is claiming that, in 2019-20, SFUSD enrolled 61,031 students but had an average daily attendance of only 50,096 (82% of enrollment). Over 10,000 students absent every day for an entire school year! SFUSD has chronic absenteeism issues but it’s not that bad. Historically, attendance is about 95% of enrollment.
The reason the enrollment numbers are wrong is that they’re including students enrolled in all the charter schools that have received their charters from SFUSD. As the sponsoring district, SFUSD has some oversight responsibilities for these schools but it is not responsible for the day-to-day running, administration, or funding of the schools. It doesn’t make sense to include their enrollment in a discussion of SFUSD. SFUSD itself never counts charter school students when reporting on its enrollment, as the report authors should have known because they linked to this SFUSD presentation about its enrollment.
Here, from the same source the report used, is the actual enrollment in SFUSD:

We can see that enrollment in SFUSD schools (“Non-charter school enrollment” above) was flat in the 2010s before falling by 4,000 after the pandemic.
The report on district administrative costs produced earlier this year by the Board of Supervisors also made the error of including charter schools in the district enrollment figures. What is odd is that the report wanted to make the case that SFUSD’s administrative costs are too high and was using the enrollment figures to calculate a cost per student. It would thus have strengthened the argument if they had used the correct enrollment number in the denominator because fewer students means a higher cost per student.
Payday Loans
The first claim UESF makes in the report, and the topic that gives the report its title, is that SFUSD makes too much use of a form of borrowing called Revenue Anticipation Notes (RANs). The report calls these “payday loans”.
The report is correct in its general message that regular use of RANs is a symptom of financial mismanagement. Just like people don’t take out payday loans if they have enough cash to tide them over until payday, well managed districts don’t need RANs because they maintain strong reserves to tide themselves over until the next installment of money from the state comes in. Clovis Unified, which has never issued a RAN, had more than 10 months of reserves the last time I checked and was busy debating whether its reserves were too large (see this neat explainer video from Clovis about reserves). SFUSD has had recourse to RANs so often because it doesn’t maintain strong reserves. It has trouble meeting the statutory minimum of 2 months reserves. Of course, building up SFUSD’s reserves would require even greater budget cuts than those already being discussed…
The analogy of RANs and payday loans doesn’t stand up to close inspection. Payday loans are known for their usurious interest rates because the borrower has nothing to offer as collateral. RANs tend to have low interest rates because they are secured by the revenue the district is due to receive from the state or the city.
So far, this is just quibbling about words and I wouldn’t even have mentioned it were it not for the fact that the report attempts to calculate the cost of RANs to SFUSD and gets its numbers all wrong.
Here’s how it says it calculates the cost of RANs to SFUSD:
By multiplying the principal amount by the interest rate, subtracting the premium paid by the purchaser and adding on the underwriter's discount, the district’s cost of borrowing through RANs was determined to be $30,226,718 for the years in which disclosures were available, averaging $1,314,205 that was paid on top of the principal each time the district took out a RAN.
It then gives a big table of RANs issued by the district over 30 years. Here are the first few lines:

Let’s focus on the 2021 issue. The author calculated the cost of borrowing by multiplying $100,000,000 by the 2% coupon and subtracting the issue premium i.e. (100,000,000 * 0.02) - 1,498,000 = $502,000. This is hot garbage, for two reasons:
It’s not what they said they were going to do. They said they were going to add on the underwriter’s discount but didn’t.
It’s meaningless anyway. If the notes always had a duration of exactly one year, $502,000 would represent the dollar return to the investors i.e. the difference between what they lent at the beginning and what they received at the end. But the notes are for varying lengths of time and this changes the interest calculations. The author has just ignored or been ignorant of this.
Let’s look at how the cost of issuance for the 2021 RAN should be calculated. Here are the actual details of the note:
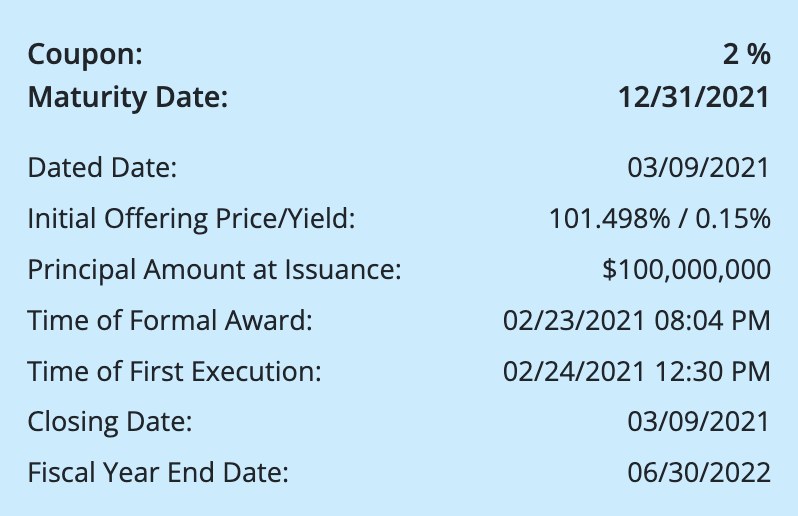
On 02/23/2021, SFUSD formally awarded the job of issuing the notes to the underwriter. On 02/24/2021, investors agreed to pay 101.498% of the principal amount. No money changed hands at that point.
On 03/09/2021, investors handed over $101,498,000 and the note started accruing interest. The underwriter kept $75,000 and another $125,000 went in fees to miscellaneous advisors, lawyers, and agents. The district received $101,298,000.
On 12/31/2021, the note matured. The district paid back the $100,000,000 principal plus the accrued interest of about $1,622,222 (there was no intermediate coupon on 6/30). The interest is not $2m because the loan was for only about 81.1% of a year. Since the investors paid $101,498,000, they earned $124,222 which represents an annualized yield of 0.15% on their investment. The total cost to the district was $324,222 (interest plus the fees and discount), which represents an annualized cost of 0.39%.
0.39% is not the cost of a payday loan and $324,222 or $124,222 is a long way from the $502,000 calculated in the report. It’s baffling to me that someone knowledgeable enough about finance to come up with the idea of writing about RANs, and diligent enough to uncover the data about every RAN issued by the district going back 30 years, could make such an elementary calculation error as getting the term of the loan wrong.
Conclusion
Although it has taken me quite a lot of space to demonstrate that some of the numbers in the report are wrong, the fact that they were wrong in the first place leaped out to me as soon as I read the report. Admittedly, I’m more versed in the data than most, but I feel like anyone who has been paying attention at Board of Education meetings should have been able to read the report and go: “wait, attendance has not recovered” or “those enrollment numbers seem high.” In other words, a bit of proof-reading wouldn’t have gone amiss.
On a personal level, when the numbers I can check are suspect, it causes me to doubt the numbers I can’t check.
Working with ADAs is a real pain because it seems like you never see the same number twice. The 2021-22 ADA numbers are particularly hard to nail down. School Services of California, which produces the definitive reports on salaries and benefits for districts, shows a P-2 ADA of 44,706. The district’s unaudited financials show that 2021-22 P-2 ADA was 44,635 and its Annual ADA was 44,794. The CDE’s Current Expense of Calculation report, which is based on the Annual ADA, also shows 44,794. The UESF report got its data from ed-data which in turn sourced it from the Current Expense of Calculation report so it also shows 44,794. But the CDE’s Principal Apportionment reports, which are the ones that actually determine funding, show a P-2 ADA of 44,617 and an Annual ADA of 46,605. I’ve no idea where the extra nearly 2,000 ADA suddenly came from. For our purposes here, it doesn’t matter. All that matters is that it is undisputed that the 2021-22 ADA was well down on the pre-pandemic ADA.
Thanks for clearing up the data.
It’s surprising that the UESF report calls RANS usurious when they are very low interest short term borrowing.
Also...was this written by the only person in SF who doesn’t know enrollment is declining?