Student eligibility for free or reduced price meals is the standard measure of poverty in a school district. It varies enormously within districts and between one district and another. SFUSD is planning a redesign of its elementary school assignment system with the goal of equalizing across schools the percentage of kids who are eligible for free-and-reduced price meals. This post will examine the distribution of poverty in SFUSD schools, how it relates to race, language programs, and geography, and how that will complicate the school assignment redesign.
Terminology
I’m going to be using three terms that are related but measure different things.
FPRM eligibility: The standard way to measure poverty in schools has been to look at the percentage of kids who are eligible for free or reduced-price meals i.e. the FPRM-eligibility rate. “To qualify for a free lunch under federal guidelines, a family of four must make less than $34,000 a year. A reduced-price-lunch requires an annual income of less than $48,000”1 California has recently introduced a program that gives free meals to all kids regardless of income but the federal definition is unchanged.
Socioeconomic Disadvantage: Many school assessment and enrollment reports break down the results by subgroup such as gender or race or parental education. FPRM-eligibility is not a reporting subgroup but socio-economic disadvantage (SED) is. Socioeconomic status is a catchall category. All children who are FPRM-eligible are, by definition, socioeconomically disadvantaged. So are those who are migrant, homeless or in foster care and those whose parents did not graduate high school2. Most but not all of the kids who fall into these additional categories are also FPRM-eligible and hence the percentage who are socioeconomically disadvantaged will be just a little higher than the percentage who are FPRM-eligible.
Unduplicated Pupil Count (UPC): The school funding formula in California grants extra money based on the Unduplicated Pupil Count (UPC) which includes those who are FPRM-eligible and those who are English Learners. Whether the funding formula will change now that parents have no need to report income in order to become FPRM-eligible is unclear, at least to me.
Fewer SFUSD Kids Are Poor. Or Are They?
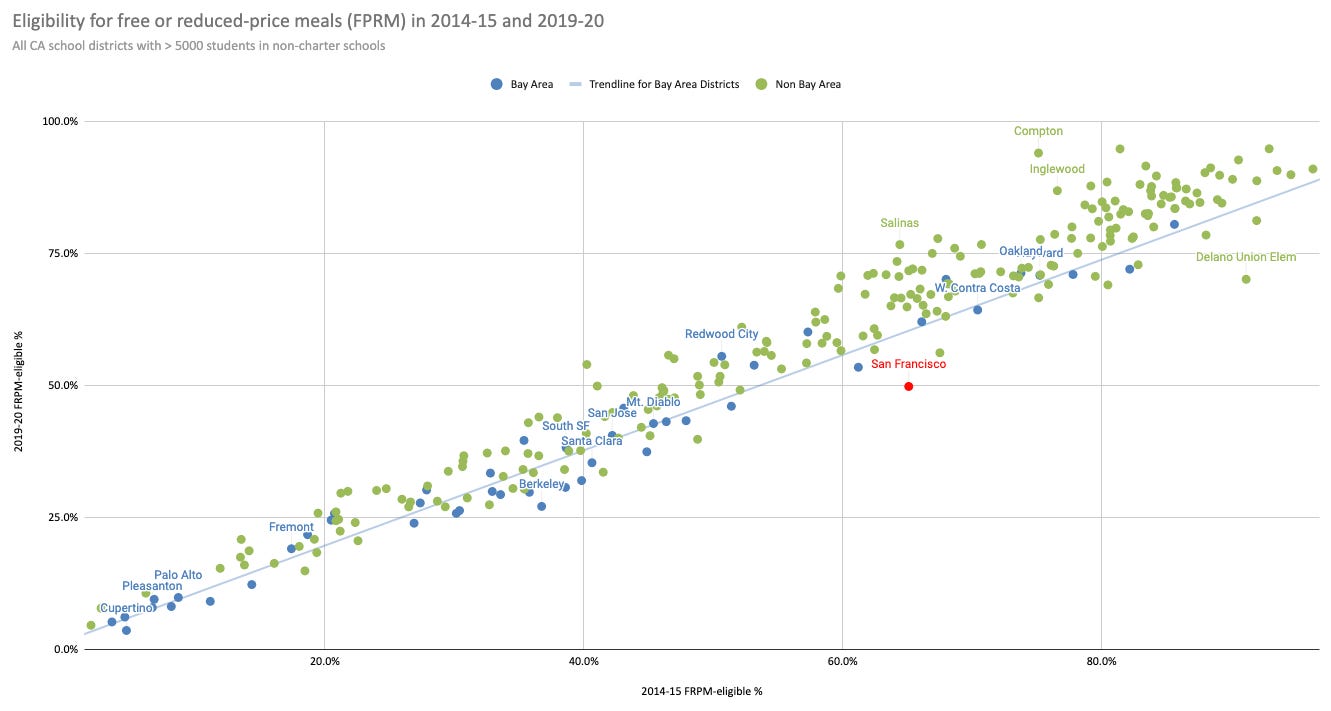
The percentage of FRPM-eligible children in SFUSD schools fell from 65.1% in 2014-15 to 49.9% in 2019-20. Those percentages are a little higher than you’ll see here on Dataquest because I’m excluding the charter schools. Five Keys in particular distorts the data because their students are primarily adults who are thus not eligible for FRPM. (I’m ignoring the pandemic years because of obvious data quality concerns). That’s a big drop. FRPM rates don’t usually change that much that quickly. Here’s a chart comparing the FPRM eligibility rates in 2014-15 and 2019-20 in all California school districts with at least 5000 students. SFUSD’s drop is plausible but it’s clearly an outlier.
One possible explanation is that the economy boomed and raised family incomes so significantly that many kids no longer qualified. If that were true, we would expect neighboring school districts to show similar declines. There is some weak evidence for this: Berkeley did also experience a significant drop (and it started out well below 40%) but other Bay Area districts, such as San Jose and Oakland experienced hardly any change.
Another possible explanation is that SFUSD just got worse at getting families to fill out the Multipurpose Family Income Form (MFIF). That form used to be paper-based and principals could track those who had submitted the form and chase after those who hadn’t. Now it’s primarily online and privacy rules make it very difficult for principals to know who has yet to submit the form. SFUSD presumably knows whether the completion rate for the MFIF has fallen but I haven’t seen that data published anywhere.
To the extent that getting parents to fill out the form became a problem, this cost the district money. 8000 fewer students were marked as FPRM-eligible in 2019-2020 than five years earlier (enrollment was flat between the two dates). Suppose that half of them were no longer eligible because their parents’ income had increased and half were in fact eligible but just didn't fill out the form. Those 4000 eligible-but-not-registered students were worth a lot of money to the district. Let’s do some quick math to figure out how much.
The funding formula for school districts is based on the Average Daily Attendance and the Unduplicated Pupil Count. In 2019-20, a normal student with perfect attendance was worth about $8600 to the district (the precise number varies by grade - this is a weighted average). A student who was included in the Unduplicated Program Count on account of being an English learner or FPRM eligible was worth an additional $6020 (there’s a 20% “supplemental grant” for every such student and a further 50% “concentration grant” bonus when the district’s UPP exceeds 55%, as SFUSD’s does). Some of the 4000 FPRM-eligible students are also English learners and so would be included in the count because of their English learner status. Under 30% of all students are English learners but I’m guessing that it’s a higher percentage among the FPRM-eligible and that the parents of FPRM-eligible English learners are less likely to submit the form than the parents of FPRM-eligible kids who are fluent in English. Let’s say that half of the 4000 FPRM-eligible students are English learners. That leaves us with 2000 FPRM-eligible-but-not-registered students, each of which would be worth $6020 to the district with perfect attendance. That’s about $12m per year.
If it is true that the FPRM-eligibility rate went down because of poor data collection rather than rising incomes, the district had a strong financial incentive to improve it. Obvious ideas include extra dollars to schools with the highest completion rates or bonuses to principals at schools that exceed a certain threshold or a lottery open to everyone who submits the form. There’s probably a law preventing education dollars being used for a lottery but funding such a lottery might be a good way for some education-interested foundation to have a greater impact than simply donating dollars directly.
Poverty and Race
I went searching for a breakdown of FPRM-eligibility by race/ethnicity. It proved impossible to find. The standard enrollment reports do not even include a breakdown of socioeconomic status by race/ethnicity. I eventually found two sources:
The 2028-19 SBAC (Smarter Balanced Assessments) results file available from the California Department of Education. This shows that 55.0% of SFUSD’s kids were socioeconomically disadvantaged that year and breaks it down by race and socioeconomic status. That 55% is pretty much in line with expectations if about 50% were FPRM-eligible.
The 2021-22 enrollment overview available on SFUSD’s Data Dashboard. This shows 48.9% of students being socioeconomically disadvantaged. A drop of 6% in 3 years is a lot. It is possible that the pandemic has disproportionately driven SED kids out of the city. It is more likely that the district has not prioritized collecting the MFIF forms and so is undercounting the percentage.
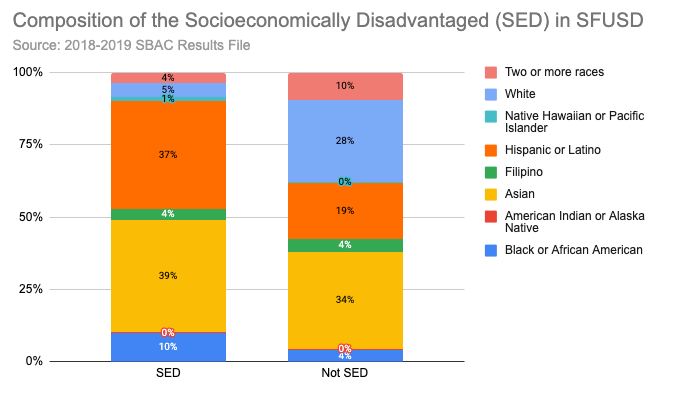
Using the data from the SBAC file here is the percentage of each racial/ethnic group that is socioeconomically disadvantaged (SED):
Some things that stand out:
Only 18% of White students and 32% of Two or more race students are SED. For all other groups the percentage is over 50%.
The percentage of Asian students who are SED (59%) is much closer to the percentage of Latino (70%) and Black (75%) students who are SED than to the percentage of White students who are SED (18%). So much for being “White-adjacent”.
This means that the composition of the SED and non-SED groups looks very different.
White students comprise 5% of the SED students but 28% of the non-SED students.
Latino students comprise 37% of the SED students but only 19% of the non-SED students.
Asian students form the largest group among both the SED and non-SED populations. They are 39% of the SED and 34% of the non-SED.
FPRM-Eligibility By School
There wasn’t much difference in the FPRM-eligibility rate by grade level (2019-20 data).
K-5: 50.5%
K-8: 45.5%
6-8: 52.3%
9-12: 48.6%
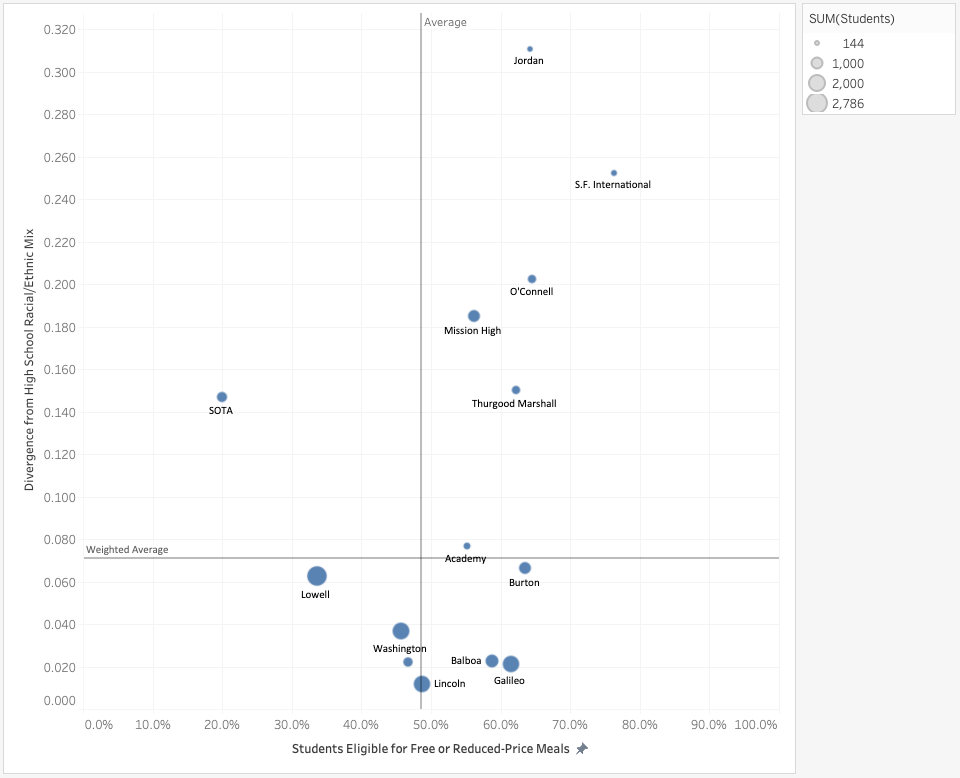
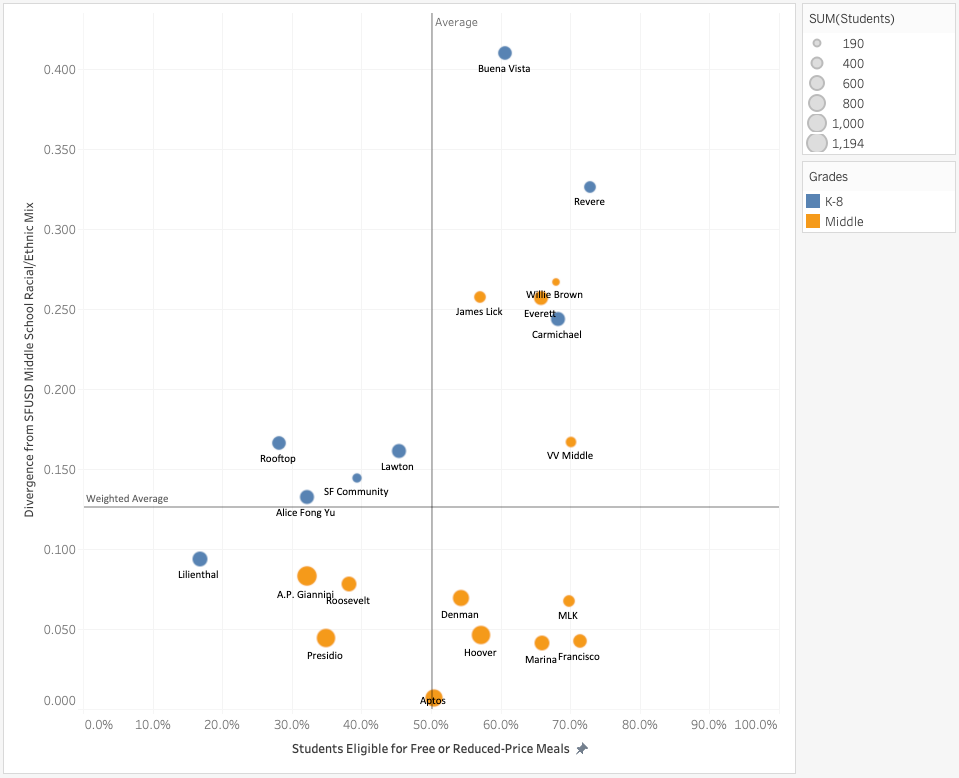
It is interesting to compare FPRM-eligibility rates with the racial divergence scores produced for prior posts. Recall that a racial divergence score measures how far a school’s racial mix diverges from the district’s racial mix.
High Schools
At the high school level, there is not a huge amount of variability in the FPRM-eligibility rate. As the following chart shows, most schools are within 15 percentage points of the high school average. The only ones outside that range are SOTA, SF International, O’Connell, and Jordan. Lincoln, the school with the lowest racial divergence score (i.e. the one whose population most closely matches the SFUSD average), is also the school that comes closest to the overall SFUSD high school FPRM-eligibility rate. It was surprising to me that Galileo (which is majority Asian) has a higher FPRM-eligibility rate than Mission (which is majority Latino).
Middle Schools
At the middle school level, we start to see more variability. Again, the school with the lowest racial divergence score, Aptos, also comes closest to the district average FPRM-eligibility rate. But we start to see a bunch of schools differ from the district average by more than 15%. Claire Lilienthal has the lowest FPRM-eligibility rate but it has a much lower (i.e. better) racial divergence score than the average. On the other hand, Lawton has an above average (i.e. bad) racial divergence score because it’s 75% Asian but comes very close to the district average FPRM-rate.
Elementary Schools
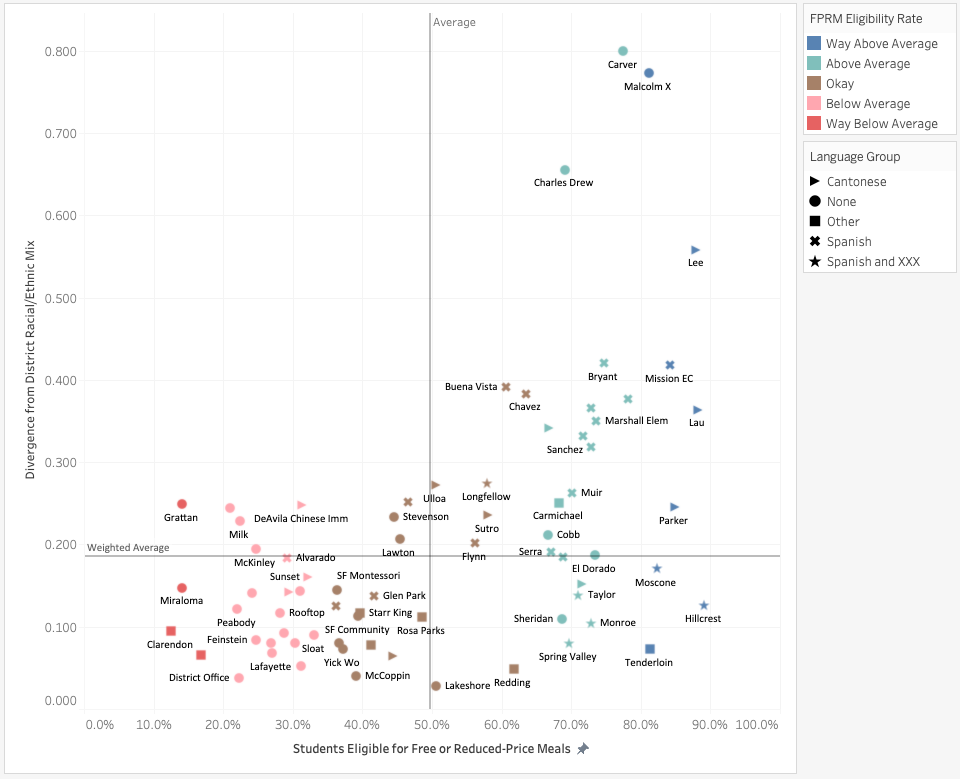
The elementary school level is where we see the most variance. Almost exactly half (49.7%) of students in elementary and K-8 schools were FPRM-eligible but the range was enormous with Clarendon (near Twin Peaks) at one extreme having 12.5% and Hillcrest (in the Excelsior district) at the other extreme having 89.1%.
The relationship between racial/ethnic diversity and poverty (as measured by percentage of FPRM-eligible students) is complex. It’s true that Lakeshore, the school with the lowest racial divergence score is also within 1% of the district average FPRM rate. But it’s also true that Clarendon and Hillcrest, the two extremes of our range, both have quite low racial divergence scores while Ulloa, the school that comes closest to the district average FPRM rate, has a high racial divergence score (it’s in the Sunset and offers Cantonese immersion so it’s 80% Asian).
Here is a graph comparing racial divergence and FPRM rates. The averages for both divide the graph into quadrants. SFUSD is planning to change its elementary school admissions process to a system of zones. None of the details of the zones has yet been made public. The one thing SFUSD has said is that the intention is that all schools should be within plus or minus 15% of the district average FPRM rate. I’ve used color to indicate those schools that fall within that plus or minus 15% range (“Okay”), those that are more than 15% but less than 30% away from the average (“Above Average” and “Below Average”), and those that are more than 30% away from the average (“Way Above Average” and “Way Below Average”).
The top right quadrant contains the schools that are very far from the district average racial mix and have above average numbers of FPRM-eligible kids. These are the three majority Black schools and a whole bunch of schools that offer either Spanish or Cantonese language programs.
The bottom right quadrant contains the schools that have above average numbers of FPRM-eligible kids but which reflect the racial diversity of the district well. Notice that all the schools that offer both Spanish and Cantonese fall into this category as do the schools that offer Vietnamese (Tenderloin) and Arabic (Redding) programs.
The bottom left quadrant contains the schools that reflect the racial diversity of the district well and have below average numbers of FPRM-eligible kids. Most schools in this quadrant offer no language programs but the schools that offer Mandarin, Japanese, and Korean all fall in this quadrant as do three schools that offer Spanish and three that offer Cantonese. Two of the three Spanish programs and all three Cantonese programs are Dual-Language Immersion. Glen Park is the only school with a Biliteracy program that is under the district average in FPRM-eligibility. Biliteracy programs are designed for native speakers of the target language so most eligible students will be either Latino (for Spanish) or Asian (for Cantonese). In contrast, DLI programs want a mix of English-only, bilingual, and English learners. A Latino/Asian kid who qualifies for one of the bilingual slots in a DLI program almost certainly has at least one English-speaking parent and, since English proficiency is correlated with income, is less likely to be FPRM-eligible than a Latino/Asian kid in a biliteracy program. In addition, the availability of English-only slots opens DLI programs to White students who, as we’ve seen, have low FPRM-eligibility rates. I suspect this explains why there’s only one Spanish or Cantonese biliteracy program among the schools in this quadrant.
The top left quadrant is the most sparsely populated. It contains the schools whose populations diverge more than average from the district racial mix and yet have below average numbers of FPRM-eligible students. Four of the schools here are majority White, three are majority Asian and one is majority Latino (Dolores Huerta, in Fairmount on the Noe/Glen Park border).
The New Elementary School Admissions Process
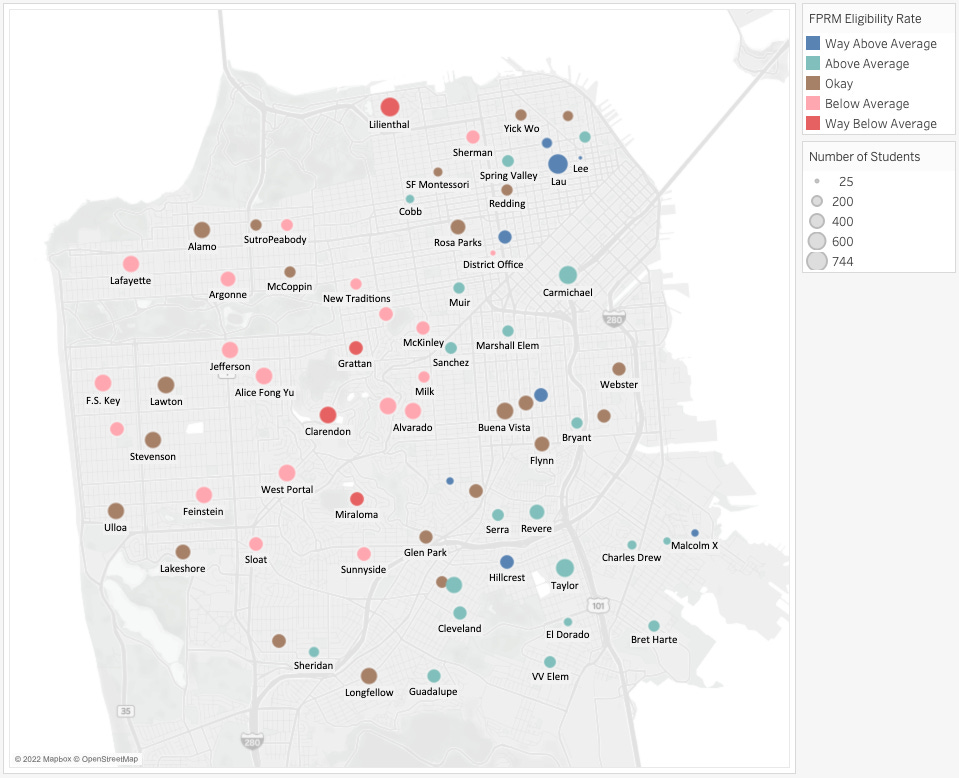
Here’s a map of the city with the location of the schools shown using that same color scheme. An interactive version of the map is here. It’s possible to draw a line running North-South (well, closer to NNE-SSW) where all the schools with too few FRPM-eligible students are to the west of the line and all the schools with too many FPRM-eligible students are to the east of the line. Roughly speaking, in order to equalize the FPRM rates, each zone will need to contain schools that are currently colored pink or red and schools that are currently colored blue. (It’s only roughly speaking because the zone boundaries won’t match the boundaries of the current school attendance areas, many schools already draw students from outside their attendance areas or have no attendance area, and the district is probably using the same sort of software political parties use to gerrymander constituencies in order to get the desired balance in each zone).
For example, from where is F.S. Key in the Outer Sunset going to draw the extra FPRM-eligible students that it needs in order to bring it within range? From where is Malcolm X in Bayview going to get all the students from more well-off families it needs to bring it within range?
A lot of east-west commuting is clearly in the offing. The discussion about the new elementary school assignment process has been controversy-free so far because it has operated entirely in the abstract. There has been nothing specific to support or oppose. When the district gets around to proposing specific zones and then enforcing the plus-or-minus-15% band during the assignment process, I expect things to heat up.
Part 2 of this post will look at other school districts to see whether their elementary schools have similar variance in FPRM-eligibility rates as San Francisco and consider the possible effect on student achievement.
https://www.nytimes.com/2021/10/01/us/california-free-lunch.html#:~:text=To%20qualify%20for%20a%20free,income%20of%20less%20than%20%2448%2C000.&text=In%20California%2C%2059%20percent%20of,is%20quite%20likely%20much%20higher.
SFUSD technically cannot count this last group accurately because the enrollment form only asks about the education level of one parent and neither parent must be a HS grad for a child to be SED



Great analysis, as usual. What I'm still really not grasping is what the district is trying to accomplish with its new elementary assignment policy. I don't understand what evidence-based research supports their claim that optimizing diversity, predictability, and proximity will improve student outcomes or familiy satisfaction. They cite no research, yet they're eager to throw the entire system into chaos every 3-5 years because they didn't do their research. None of this is good for kids!