

Districts with Higher SBAC Scores Are Not (Necessarily) Better
How do you distinguish what the district controls and what it doesn't?
It’s very hard to resist the temptation to think that districts with higher SBAC scores are doing better than districts with lower SBAC scores. It’s just not that simple. Figure 1 shows the average proficiency rate in the largest school districts in the state.

Here, I’m defining “proficient” to mean meeting or exceeding standards on the SBAC test and I’m taking the average of the proficiency rates in Math and ELA. You’d get slightly different numbers if you focused on Math alone or ELA alone but the basic story I’m about to tell would still be the same. Although the state average is just over 40% (46.66% in ELA and 34.62% in Math), there is a huge range: over 70% of students are proficient in districts like the East Bay’s San Ramon Valley (based in Danville) and Fremont but barely over 20% are proficient in Bakersfield and Stockton in the Central Valley.
Charts like this inevitably leave the impression that San Ramon Valley and Fremont are “good” districts while Bakersfield and Stockton are “bad” districts. This impression can be misleading. Here’s a little mind experiment. Fremont and Bakersfield are around the same size. Imagine if the staff in Fremont and Bakersfield swapped jobs. All the Bakersfield students would then be taught by teachers from Fremont and all the Fremont students would then be taught by teachers from Bakersfield. Imagine all the central office and support jobs were swapped and all the districts’ associated policies and procedures were swapped too. What difference would this make to the achievement levels of the students in both districts? My guess is very little: the primary reason Fremont’s average proficiency level is so high that Fremont is full of highly educated Silicon Valley workers, primarily Asian. Over half of Fremont’s kids have parents with a postgraduate degree. In contrast, two-thirds of Bakersfield’s students, who are primarily Latino, have parents whose education didn’t go beyond high school. Only 5% have parents with a postgraduate degree. Fremont, as a district, shouldn’t get credit for things outside its control like being blessed with a wealthy educated parent community and Bakersfield, as a district, shouldn’t be blamed for things outside its control.
Adjusting for Race/Ethnicity and Economic Status
It is well-known that achievement levels are correlated with race/ethnicity and economic status. Figure 2 shows the proficiency rates across California for Black, Latino, White, and Asian students and distinguishes between those who are SED (SocioEconomically Disadvantaged i.e. eligible for free or reduced price meals or having no parent who graduated high school or being homeless) and those who are not SED. The size of each disc represents the number of students in each group. The Latino SED column has the largest disc because 44.4% of all students in California are socioeconomically disadvantaged Latino students. The next largest group, at just 13.2%, are the non-disadvantaged White students, followed at 11.9% by the non-disadvantaged Latino students. The vertical position of the disc corresponds to the average proficiency rate of students in that group.
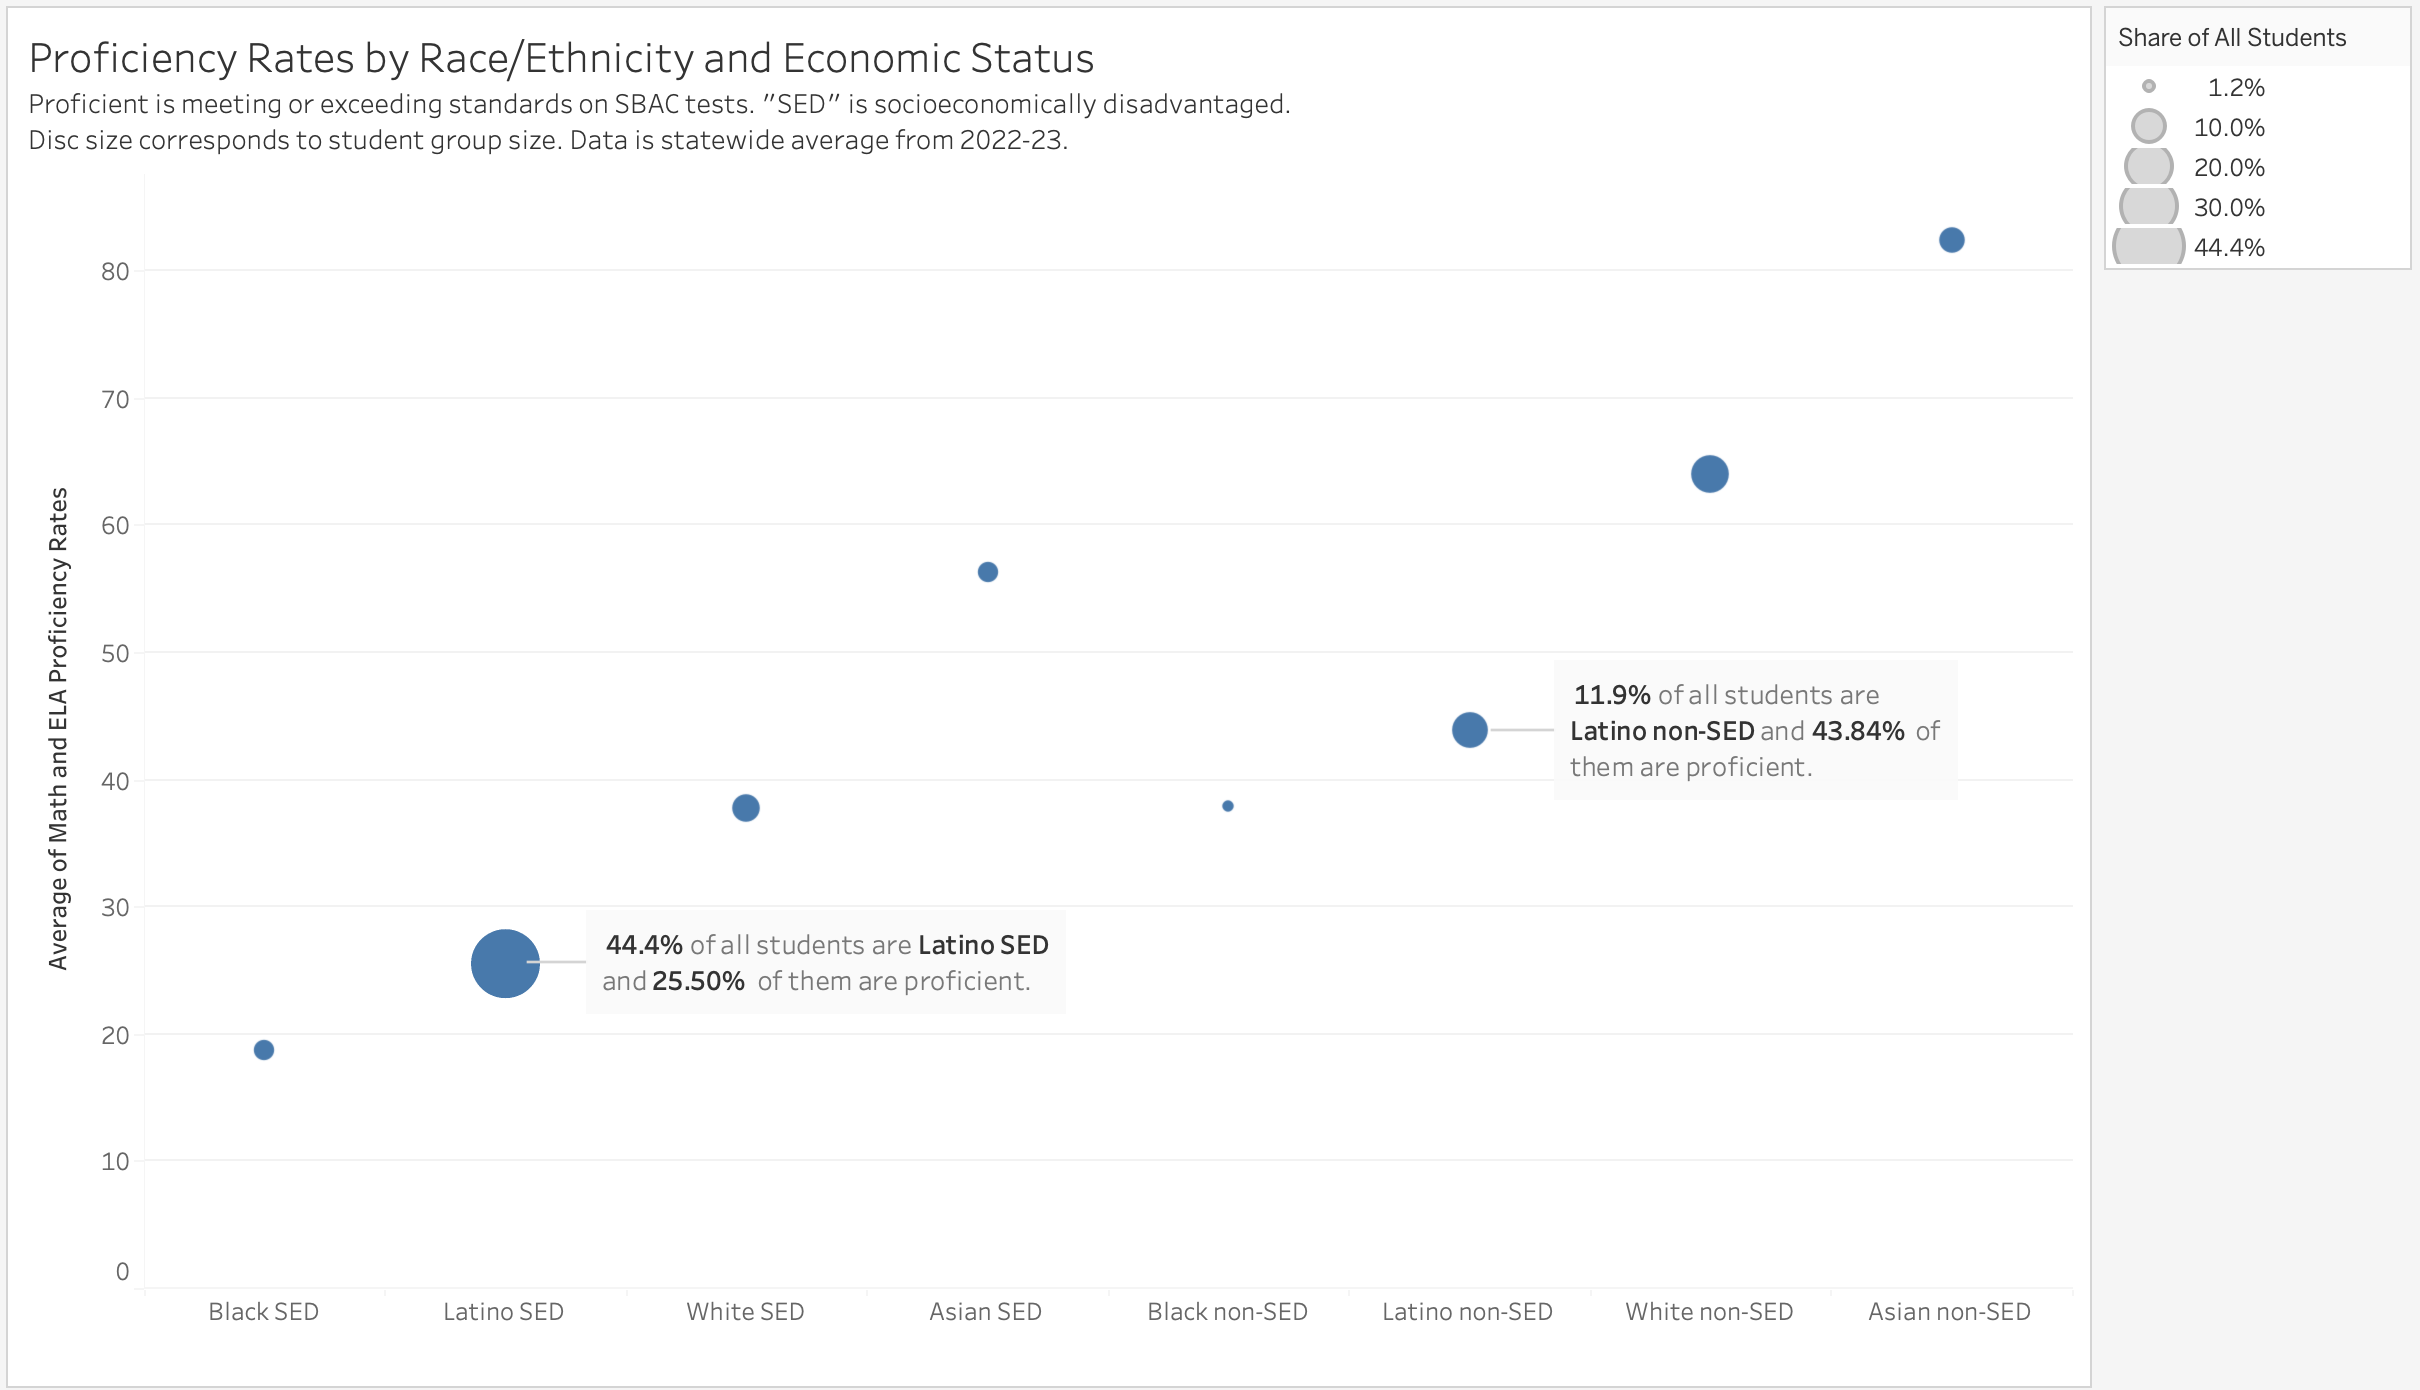
This chart illustrates three points:
The achievement gap is enormous: fewer than 20% of Black SED students are proficient (24.54% in ELA; only 12.97% in Math) but over 80% of non-SED Asian students are proficient (83.92% in ELA; 80.96% in Math).
For each racial/ethnic group, there is a big gap between the proficiency rate of its disadvantaged and non-disadvantaged subgroups. 38% of non-disadvantaged Black students are proficient, compared to only 19% of disadvantaged Black students. 64% of non-disadvantaged White students are proficient, compared to only 38% of disadvantaged White students.
Whether you look at disadvantaged (SED) or non-disadvantaged (non-SED) students, Asian students do better than White students who do better than Latino students who do better than Black students.
The possible causes for, and the appropriate policy responses to, these huge achievement gaps are among the biggest and most controversial issues in education across the nation. For my purposes, it doesn’t matter why these achievement gaps exist, just that they do exist. If they exist everywhere1, then they can’t be the fault of an individual district. A district has no control over the ethnicity, economic status, or parental education level of its students. It makes no sense to give a district credit or blame for things that are outside its control.
Controlling for the composition of a district can change our evaluation of it significantly, as looking at a couple of district pairs will demonstrate.
Los Angeles and Mt. Diablo
Figure 1 showed that only 35.8% of Los Angeles students were proficient, below the state average of 40.6%. But, as figure 3 shows, every student group in Los Angeles outperforms its peers statewide i.e. the orange discs are higher than the gray discs for each group. Los Angeles’s overall proficiency rate is lower than the state average purely because it has far more of the low scoring groups: two-thirds of its students are socioeconomically disadvantaged Latinos (65.9% vs. 44.4% statewide).

In contrast, Mt. Diablo Unified’s overall proficiency rate is slightly above the state average (41.2% vs 40.6%) but every student group in Mt. Diablo (bar the small number of non-disadvantaged Black students) underperforms its peers statewide i.e. the green discs are lower than the gray discs for each group. Mt. Diablo appears to be above average only because it has more non-disadvantaged White students (22.4% vs 13.3%). Although those non-SED White students do slightly worse than non-SED White students elsewhere in the state, there are enough of them to pull the district’s overall average above the state average.

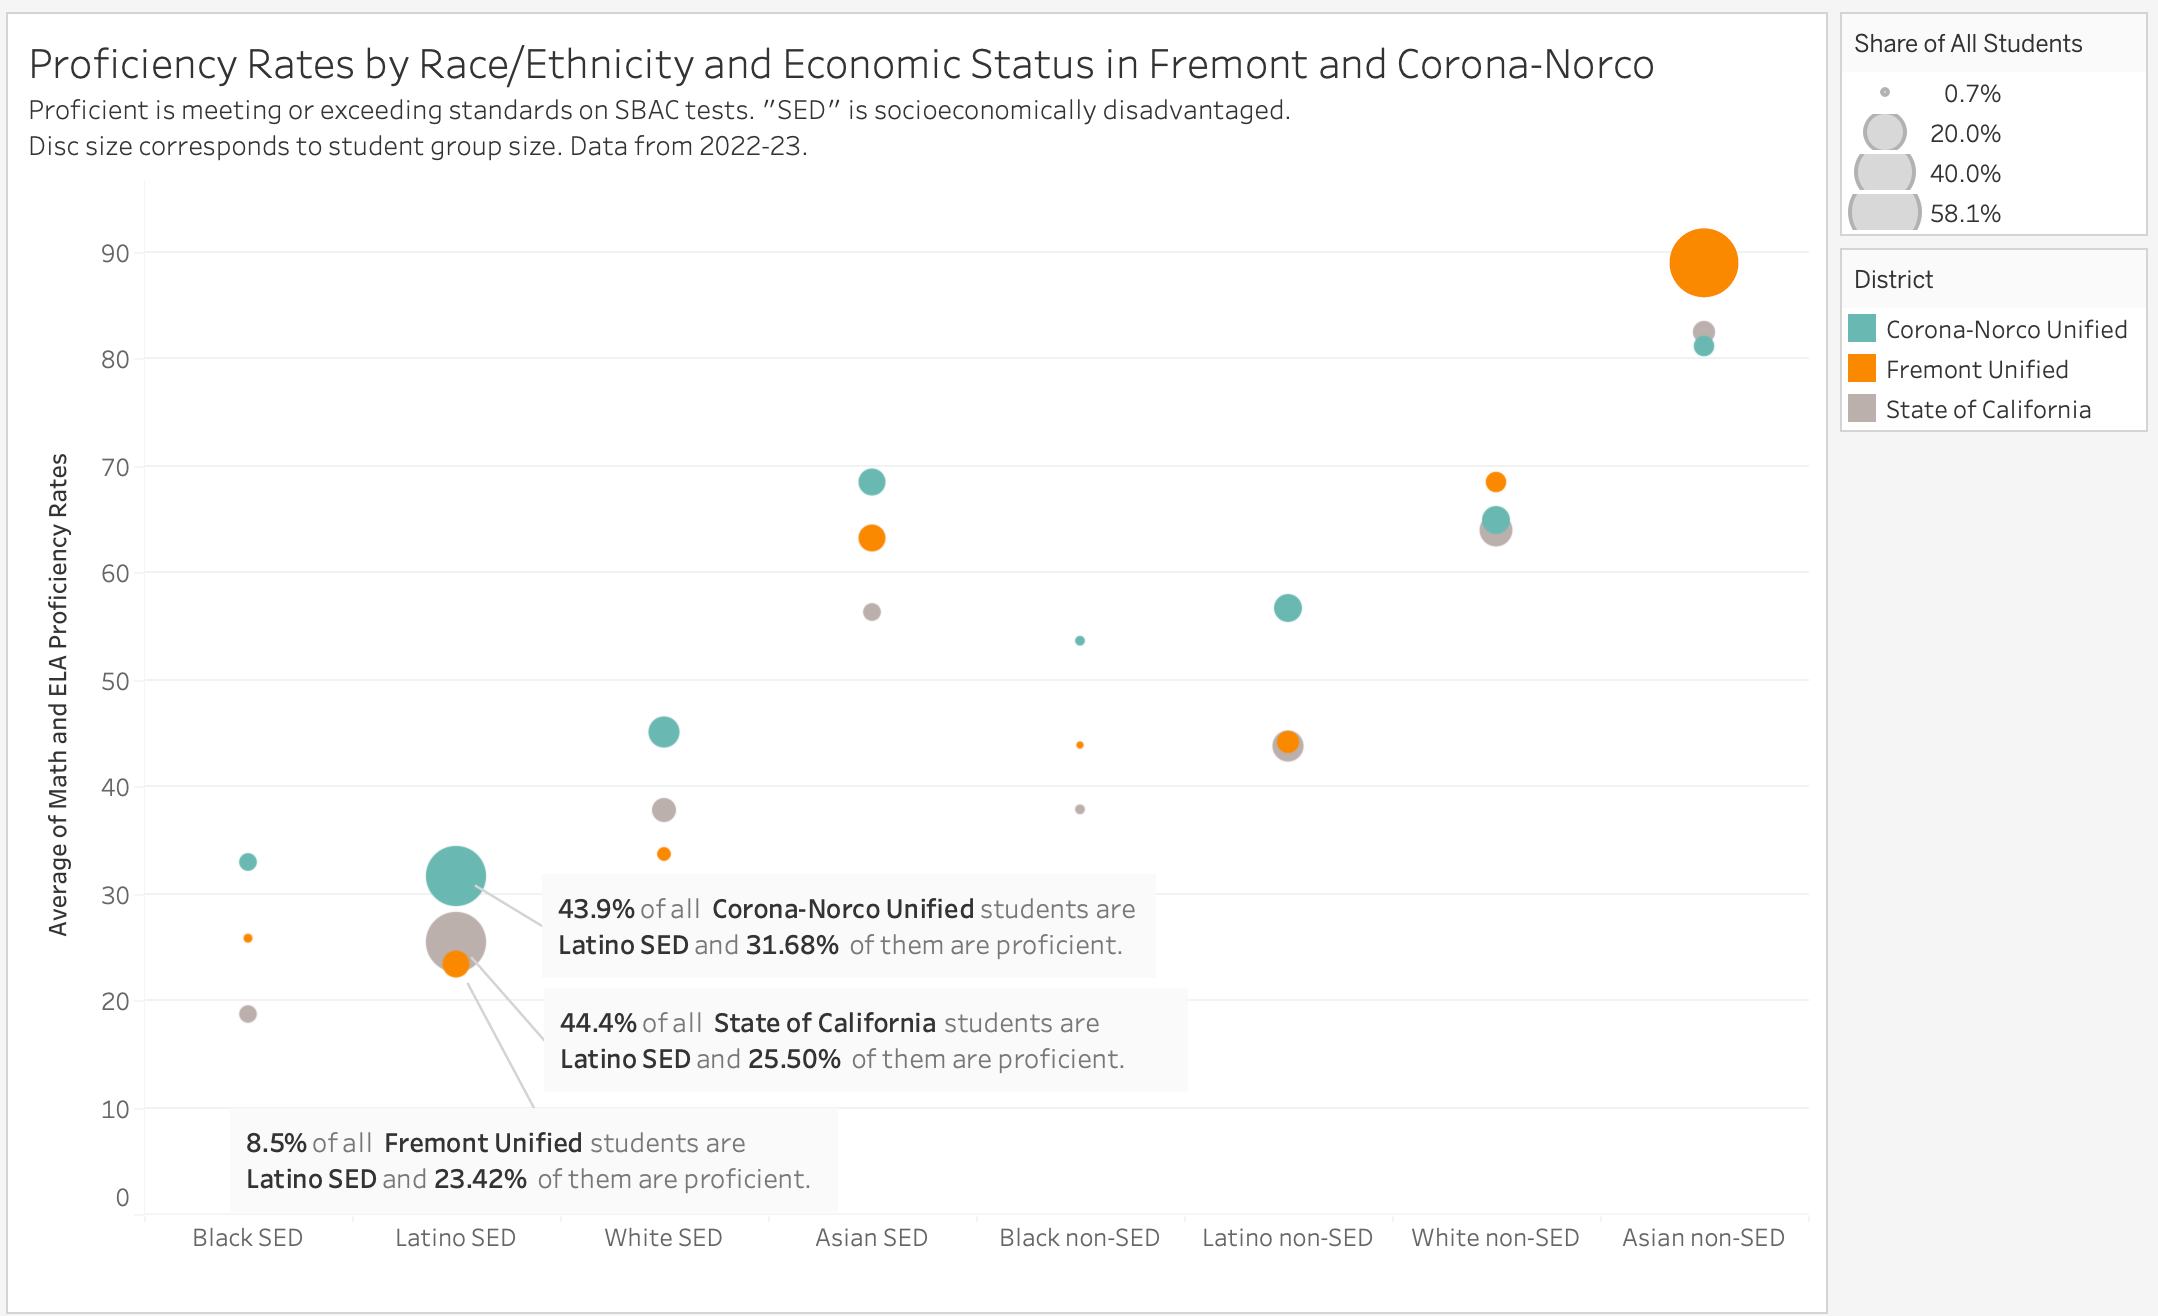
Corona-Norco and Fremont
Corona-Norco Unified in Riverside County is the sixth largest district in the state with over 50,000 students. It is a majority Latino district where 71% of students are SED. Its average proficiency rate of 46.7% is above the state average but far below Fremont’s 72.7%. Fremont is a majority Asian district where only 23% of students are SED. If we compare them student group by student group, we see that non-disadvantaged Asian and White students do better in Fremont than in Corona-Norco but disadvantaged Asian and White students and both disadvantaged and non-disadvantaged Latino and Black students do better in Corona-Norco. In fact, Fremont’s Latino SED students do worse than the state average. Despite the 26-point gap between their overall proficiency rates, it’s not clear that Fremont is better than Corona-Norco.
All students do worse in disadvantaged districts
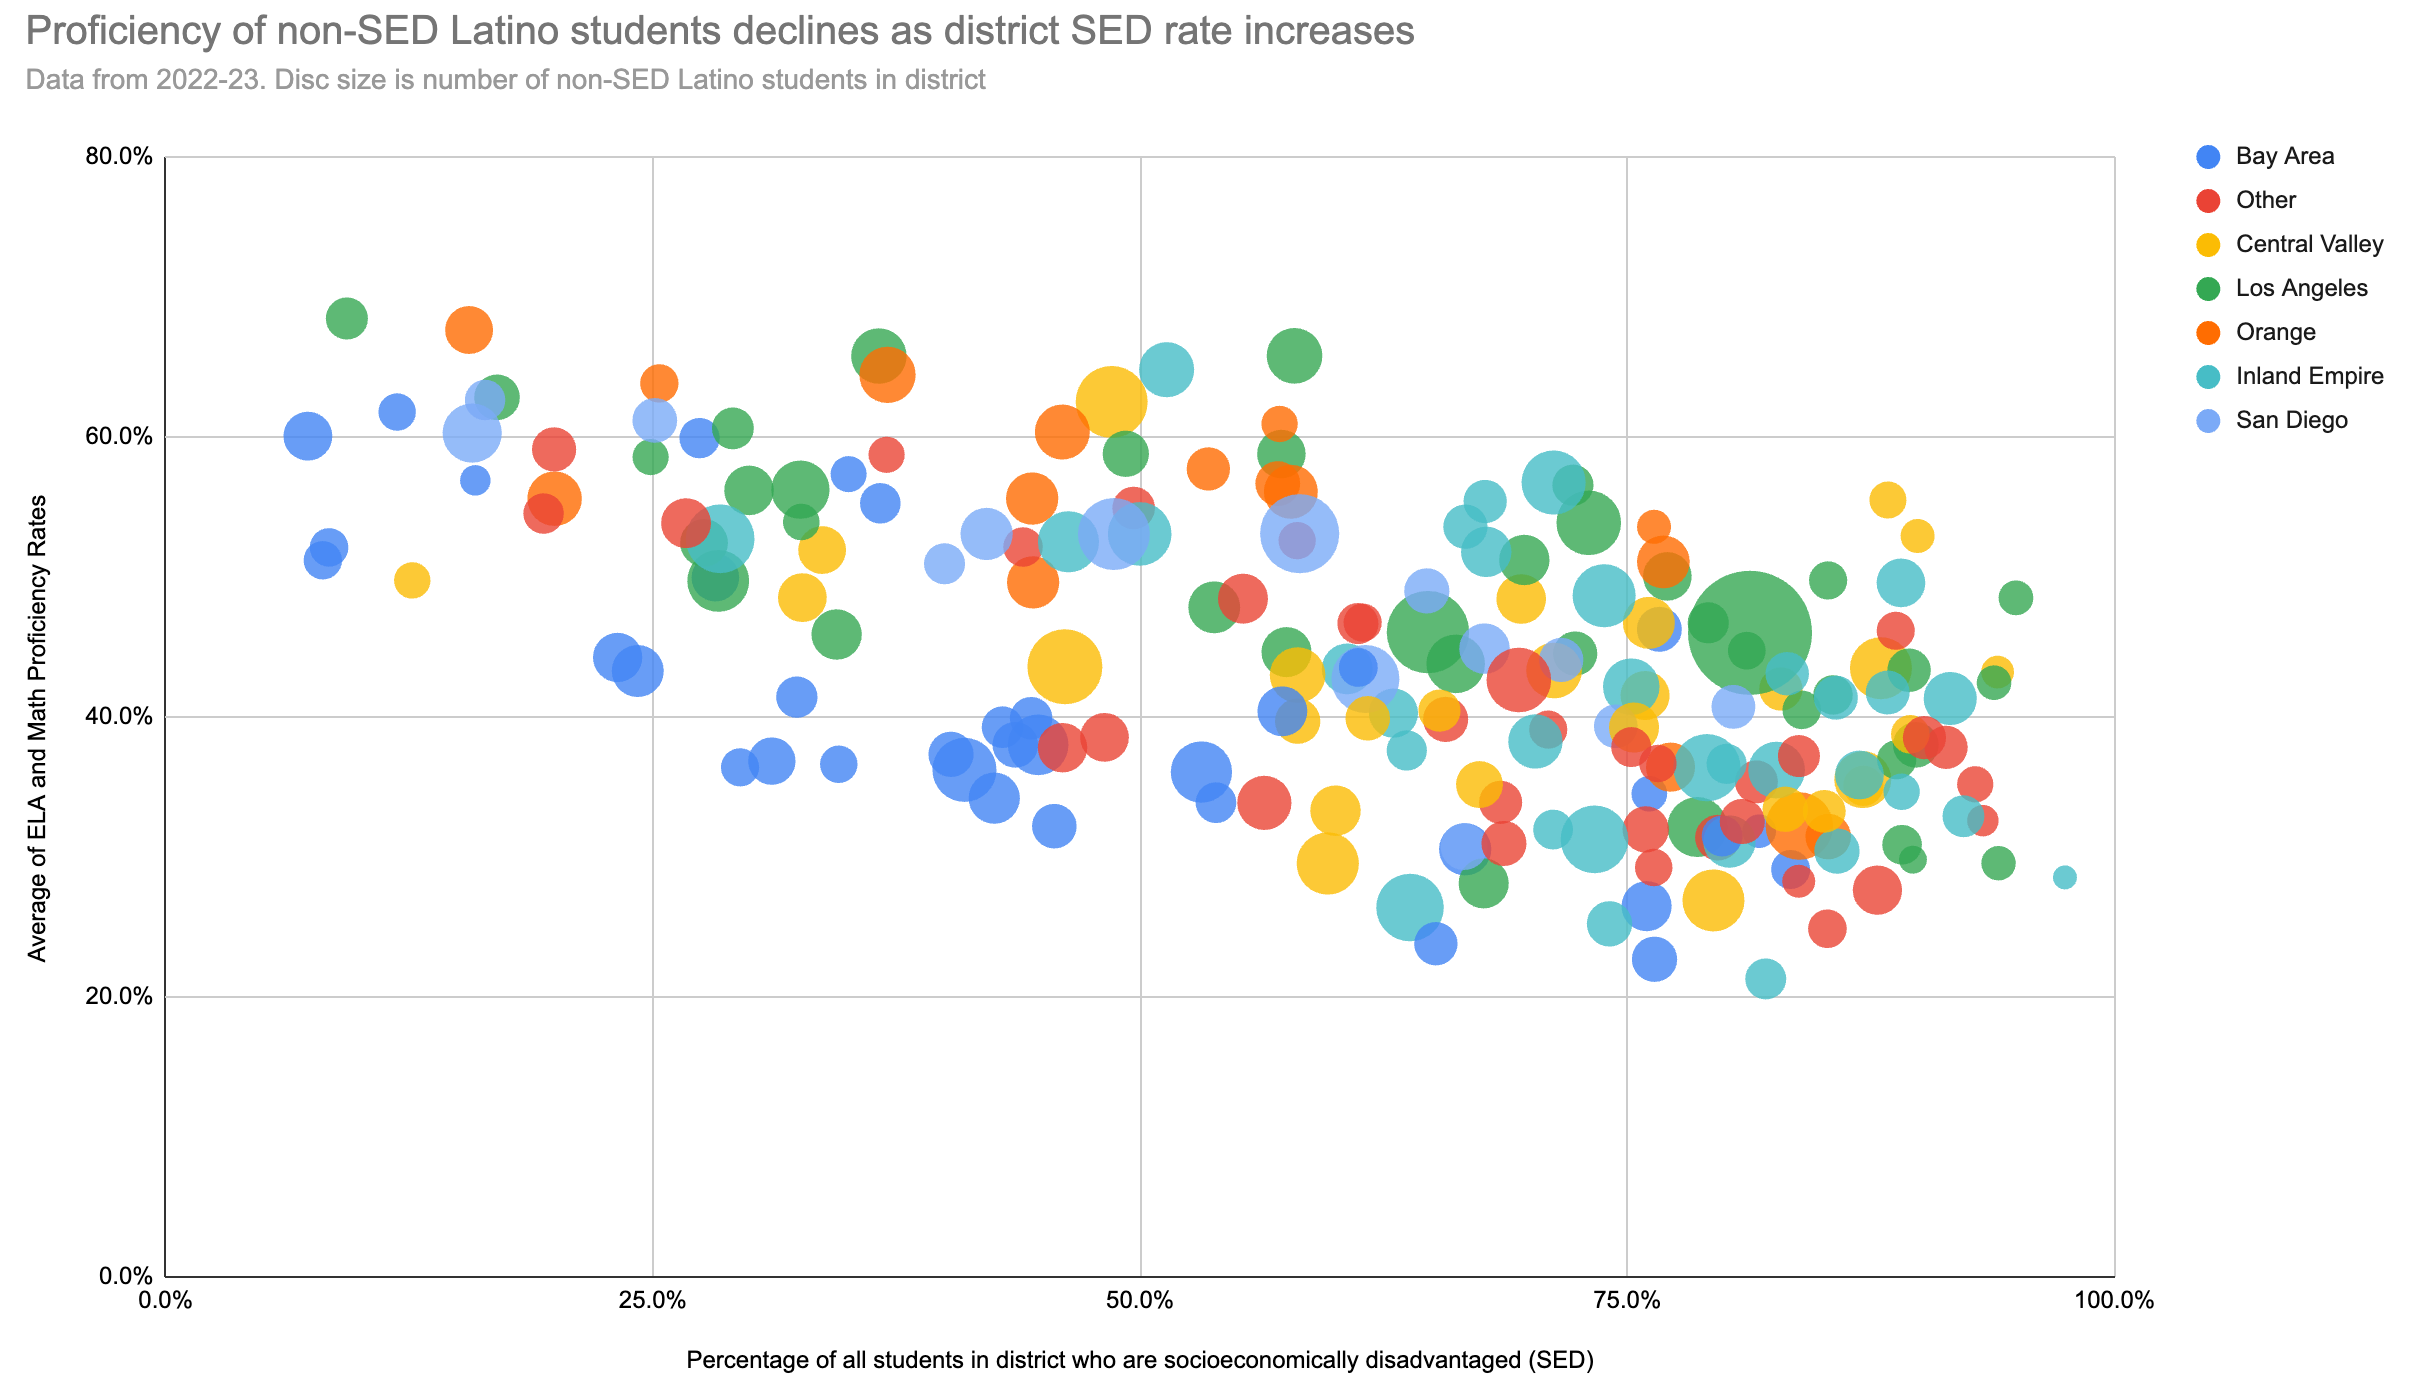
When you attempt to compare students of the same race/ethnicity and socioeconomic status from two very different districts, you encounter a new phenomenon: the more socioeconomically disadvantaged a district is the lower the achievement rate of each student subgroup. Every group of students does poorer in districts with high percentages of disadvantaged students. For example, figure 6 is a chart of the proficiency rates for non-disadvantaged Latino students:
And here is same the chart for disadvantaged Asian students:

Why do all students do worse the more disadvantaged a district is?
It’s not funding. California’s Local Control Funding Formula (LCFF) ensures that the districts with the most disadvantaged students receive the most money. They may not end up with as much as the rich “Basic Aid” districts like Palo Alto, or the districts with super-generous voters like San Francisco, but they do get more than districts like San Ramon Valley and Fremont and they’re often located in regions with lower costs of living so that money goes even further.
The simplest explanation, and one that is widely accepted by the general public, is that districts with fewer disadvantaged students provide a better education. Sometimes this better education is attributed to those districts being more likely to teach grade-level material: you can’t learn what you weren’t exposed to. Sometimes it’s attributed to higher expectations. Sometimes it’s attributed to peer effects. Whatever the attribution, it’s the assumption that lies behind parents’ push to move to a ‘better’ district or get their child into a ‘better’ school.
I don’t doubt that this explanation has some truth to it but it’s far from complete. At any level of disadvantage, there’s still a huge difference between districts. For example, in figure 7 above, if we just consider districts where around 75% of students are disadvantaged, we can see that disadvantaged Asian students are under 25% proficient in some districts and nearly 75% proficient in others. For the non-disadvantaged Latino students shown in figure 6, the proficiency range is from the low 20s to the mid-50s. That’s still a very wide range.
Most Districts Aren’t Uniformly Good or Bad
When I first started looking at SBAC scores, I assumed that in a good district every group would score above average and in a bad district no group would score above average. That assumption turned out to be naive.
In about 20% of districts, we do indeed find that every student group of any size (i.e. at least 1% of the student body) outperforms that group’s state average. ABC Unified in LA County (57.3% SED) is the platonic ideal of such a district (notice in figure 8 below how all the orange discs are well above the corresponding gray discs) but the two largest districts in the state, Los Angeles (81.3% SED) and San Diego (58.2% SED), can be found in this category as can Garden Grove in Orange County (76.9% SED), Orange Unified (57.7% SED), and nearly all districts with very few disadvantaged students such as San Ramon Valley (7.3% SED), Dublin (8.1% SED), Palo Alto (11.9% SED) , and Palos Verdes Peninsula (9.3% SED).

On the other hand, in about 30% of districts, every student group of any size (i.e. at least 1% of students) underperforms the state average for that group. These districts tend to have higher than average numbers of disadvantaged students. The largest districts in this camp are Fresno, San Bernardino, San Juan (Sacramento), Bakersfield, and Stockton. In the Bay Area, they include West Contra Costa, Hayward, Antioch, and South San Francisco2.
That means that half of all districts have at least one group that outperforms its state average and one group that underperforms its state average. Figure 9 below shows two examples: Long Beach, against which SFUSD benchmarks itself; and San Mateo-Foster City. Latino students, both disadvantaged and non-disadvantaged, do better than the state average in Long Beach and worse than the state average in San Mateo. On the other hand, Asian students, both disadvantaged and non-disadvantaged, do better than the state average in San Mateo and worse than the state average in Long Beach. How can one group of students do well in a district while another group does poorly in the same district?

Many people’s first instinct is to blame the districts and claim that their policies and practices favor or harm particular groups. San Mateo is failing its Latino students; Long Beach is failing its Asian students. I am dubious about such claims because it’s hard to identify the mechanism at play. If Long Beach is doing things that cause its Latino students to excel, do those same things cause its Asian students to do poorly? What practices, precisely, are supposed to harm San Mateo’s Latino students but benefit its Asian students? Remember, it wouldn’t be sufficient to show that, because of residential segregation, the Asian and Latino students attend different schools. You’d have to show that the schools attended by Asian students in San Mateo are better in some way than those attended by Asian students elsewhere in the state and that the schools attended by Latino students in San Mateo are worse in the same way than those attended by Latino students elsewhere in the state.
I want to promote an alternative explanation: student group outperformance or underperformance is often due to differences in group composition. The Latino students in San Mateo differ from the Latino students in Long Beach and the Latino students statewide in ways that predict their underperformance in San Mateo and their overperformance in Long Beach. Similarly, the Asian students in San Mateo and Long Beach differ in ways that predict their overperformance in San Mateo and underperformance in Long Beach.
The most important ways in which children of the same ethnicity and socioeconomic status can differ are parental education and English language ability. Districts where the parents are better educated and the kids speak English have higher achievement levels.
Parental Education
There are social advantages to growing up in a household with more educated parents. More educated parents are more likely to be able to assist with homework, afford tutors, navigate college admissions, and so on. But years of education is actually a heritable trait. There are genetic variants that are associated with greater educational achievement and those variants get passed on to children. Siblings who inherit more education-associated genetic variants begin talking at a younger age, are better able to read at age seven, spend more years in school, work in more prestigious occupations, and achieve higher incomes than siblings who grow up in the same household but inherit fewer of those education-associated genetic variants3. You can think of “education-associated genetic traits” as a proxy for intelligence but with the practical advantage that years of schooling is much easier to measure than IQ.
As figure 10 shows, the more education the parents have, the greater the chance that a child will be proficient on standardized tests.

Only 15% of children whose parents didn’t graduate high school were proficient in Math. This rose to 20% for whose parents completed high school, 29% for those whose parents completed some years of college, 49% for those whose parents obtained a bachelor’s degree and 64% for those whose parents completed a postgraduate degree4. Of course, a parent completing a degree doesn’t magically make a child smarter. But those who do complete degrees have, on average, more education-associated genetic variants than those who don’t and those variants do get passed on to their kids.
The much higher proficiency rates for college graduates is partly due to the fact that the universe of college graduates contains a far higher proportion of Asian and White parents than the universe of high school graduates. The CDE does not break down parental education levels by race/ethnicity so we can’t isolate the effect of parental education by comparing, say, the SBAC scores of Latino children whose parents graduated college with those of Latino children whose parents only completed high school. However, the census does publish education attainment by race for many places in California so we can compare the SBAC proficiency rates of students from a particular group in a district with the educational attainment rate of adults in the associated census place. This is an imperfect comparison because, among other reasons, census boundaries and school district boundaries don’t always align, but it can be illustrative.
The more college graduates a place has, the higher the proficiency rate among the children in the associated district. For example, in Berkeley (the place), 88% of White adults have at least a Bachelor’s degree, a higher rate than any other place in California. It’s not a coincidence that, among non-disadvantaged White students in the 200 largest school districts, those in Berkeley (the district) have the highest proficiency rate. In Palo Alto, 83% of White adults have at least a Bachelor’s degree and 82% of non-disadvantaged White students are proficient. In Oakland, which is not usually thought of as a high-achieving district, 81% of White adults have at least a Bachelor’s degree and 77% of its non-disadvantaged White students are proficient. By comparison, in Antioch, in the East Bay, only 28% of White adults have at least a Bachelor’s degree and only 40% of non-disadvantaged White students are proficient.

I did a crude little regression (see figure 11 above), where I compared the proficiency rate of White non-disadvantaged students in a district with the educational attainment of White, not Hispanic or Latino, adults 25 and over in the surrounding community. The R-squared was a huge 0.673, which would suggest that parental education is by far the most important factor in explaining the varying proficiency rates of White students across districts5.
Differences in parental education help to explain the phenomenon we saw earlier i.e. the average proficiency rate of every demographic group declines as the district SED rate increases. More educated parents earn more and live in districts with low SED rates. Non-disadvantaged White students in Berkeley and Palo Alto have higher proficiency rates than non-disadvantaged White students in Antioch because the White kids in Berkeley and Palo Alto have better educated parents than those in Antioch.
English-language Fluency
Long-term readers may remember that I wrote a series of posts last year about English-language fluency (see here and here and here) and showed that a simple measure like the percentage of Latino kindergarten students in a district who are novice English learners is a good predictor of how well Latino students in that district will do on standardized tests.
The combination of parental education and English-language fluency allows us to explain some proficiency differences between districts that appear superficially to be similar6. My comparison districts are all prosperous and high achieving because it’s easier to see the effects of parental education and English fluency in such districts. If every group bar one in a district is doing well, the cause probably has more to do with that group than it does the district. I’m reminded of the first line of Anna Karenina: “Happy families are all alike; every unhappy family is unhappy in its own way”.
Dublin and Pleasanton
Dublin and Pleasanton are neighboring East Bay districts. They are about the same size (6,721 test takers in Dublin; 7,208 in Pleasanton). They have very few disadvantaged students (8.1% in Dublin; 8.4% in Pleasanton). They are both majority Asian (63.3% in Dublin; 54.7% in Pleasanton). They both have very few Latino and Black students (11.3% in Dublin; 11.6% in Pleasanton) and those they have are not disadvantaged (2.4% in Dublin; 4.1% in Pleasanton). Demographically, they are about as similar as two districts can be, as figure 12 shows:

The achievement levels of their biggest groups, non-disadvantaged Asian and White students are very similar too. Where they differ is that the proficiency rate among disadvantaged Latino students is 29.3% in Dublin but only 17.7% in Pleasanton. That’s the only group to do worse than its state average. Why? Pleasanton has more than twice as many English learners, both in kindergarten and across all grades. In particular, 40% of Pleasanton’s Latino kindergartners speak a language other than English (presumably Spanish) at home, compared to only 20% of Dublin’s.
Rocklin and Davis
Rocklin and Davis are both prosperous suburbs of Sacramento with few SED students (19.9% in Rocklin; 19.4% in Davis). They have comparable numbers of White students (54% in Rocklin; 46% in Davis) and Latino students (19% in Rocklin; 24% in Davis).
Notice in figure 13 that non-disadvantaged White students do better in Davis than in Rocklin but disadvantaged Latino students do better in Rocklin than in Davis.

It is not surprising that White non-disadvantaged students perform better in Davis (75.7% vs 66.7% are proficient and 44.8% vs 34.4% exceed standards) because White adults in Davis are substantially better educated (75% have at least a Bachelor’s degree and 47% have a postgraduate degree compared with 47% and 18% in Rocklin). Davis is home to a major UC campus after all.
Meanwhile, 40% of Davis’s Latino kindergartners speak a language other than English at home, compared to only 13% of Rocklin’s. This helps to explain why Rocklin’s disadvantaged Latinos (who are the ones most likely to be English novices) are more than twice as likely to be proficient as Davis’s (39.9% vs 19.2%).
San Ramon Valley, Cupertino, Palos Verdes Peninsula
Let’s look at three other districts with very few disadvantaged students: Cupertino (15.9% SED), San Ramon Valley (7.3% SED), and Palos Verdes Peninsula (9.3% SED). Among the 200 largest districts, San Ramon Valley has the fewest disadvantaged students, Cupertino has the highest overall proficiency rate, and Palos Verdes Peninsula would have the highest overall proficiency rate if every district had the state average demographics.
In all three districts, over 90% of parents have at least a Bachelor’s degree and only 2-3% didn’t at least attend some college. The census bureau doesn’t publish a parental education breakdown by ethnicity for these locations but the overall parental education level in the districts is so high that we can infer that the Latino and Black students probably have better than average parental education levels too. It is, thus, unsurprising that nearly every group does well in those districts.

The exceptions are the disadvantaged Latino students in Cupertino, who do no better than the state average. Why are Cupertino’s SED Latino students the only group in these three districts not to exceed their state average? Well, the percentage of Latino students who speak a language other than English at home is 11% in Palos Verdes, 16% in San Ramon Valley, and 45% in Cupertino. The statewide average is 42%. Cupertino’s SED Latino students do no better than the state average because those students are at the state average level of English fluency when they start school. The Latino students in Palos Verdes and San Ramon Valley do much better because they are much more likely to start out knowing English (and their parents are almost certainly better educated than the average).
San Francisco
Figure 15 compares San Francisco’s performance with the state average. Although it makes the chart more crowded, I’ve included the results for both Filipino students and those of Two or More Races because they differ so much from the state averages.

San Francisco has some groups of students who do much better than the state averages (i.e White and Two or more race students) and some that do much worse than the state averages (i.e. Black, Latino, and Filipino students). Some, but not all, of this can be explained by demographic differences between the San Francisco students and their statewide peers.
79% of White, not Hispanic or Latino, adults in San Francisco have at least a Bachelor’s degree, far ahead of the state average. This is the major reason why White students do much better on average in San Francisco than the state average.
Students of Two or More Races do better in San Francisco than elsewhere because they are more likely to be White-Asian combinations7 then other combinations, and intermarriage rates tend to increase with education.
69% of San Francisco’s Latino students speak a language other than English at home, far above the state average of 42%. This is the major reason why Latino students do so much worse in San Francisco than elsewhere in the state.
Asian adults in San Francisco have lower education levels than Asian adults elsewhere in California. Only 51% have a Bachelor’s degree or higher, compared with 56% statewide. Moreover, 70% of San Francisco’s Asian students speak a language other than English at home, compared to 53% statewide. However, those same Asian students are more likely to be bilingual - they beat the statewide average on the Initial ELPAC and fewer of them start off as English novices. Asian students in San Francisco are also more likely to be Chinese and Chinese students are more likely to be proficient than other Asian students. In short, it’s plausible that non-disadvantaged Asian students do worse in San Francisco because of the lower parental education levels but disadvantaged students do better because they’re more likely to be Chinese and less likely to be English novices.
No group does worse in San Francisco, relative to its peers, than the Filipino students. Disadvantaged Filipino students underperform by 15 percentage points (only 38.6% are proficient, compared to 53.6% statewide) while non-disadvantaged Filipino students underperform by 12 percentage points (56.5% are proficient, compared to 68.6% statewide). The fraction of Filipino students who are English learners is higher in San Francisco (16% vs 11.6%) but those levels are way too low to account for the observed proficiency difference. There is no data on educational attainment for Filipino adults so I have no idea how the level in San Francisco compares to the statewide level.
Similarly, the demographic factors we’ve looked at don’t explain why Black students do so much worse in San Francisco than elsewhere in the state. English proficiency is not the issue: only 14 out of 259 Black kindergartners didn’t speak English at home. Nor is it parental education: 38% of San Francisco’s Black adults have at least a Bachelor’s degree, compared with 30% statewide.
Is there some other demographic factor that might explain the underachievement of Black and Filipino students in San Francisco? If not, is it SFUSD’s fault? Is SFUSD doing something that harms those student groups specifically? Or is it doing something that specifically favors White and Two or more race students? I really have no clue. If any reader has any idea for what might explain things, I’d be happy to look at the data.
“Everywhere” is an exaggeration. It is generally true that Asian students score higher than White students who score higher than Latino students who score higher than Black students. Generally true but not universally true: in 58 of the 200 largest districts, Black students outperform Latino students; in 26 districts, White students outperform Asian students; in four districts, Latino students outperform White students. All four were exceptionally poor (at least 88% of students being socioeconomically disadvantaged) and White students comprised < 1.2% of the students in those districts. The largest was Compton Unified in Los Angeles, where Latino (38% proficient) and Black (28% proficient) students both scored higher than White students (only 23% proficient). But White students are only 0.2% of the student body in Compton.
To be fair, some of these districts have one or two groups that do beat their state averages but which form less than 1% of their districts e.g. disadvantaged Black students in SSF or disadvantaged American Indians in West Contra Costa.
See “The Genetic Lottery: Why DNA Matters for Social Equality” by Kathryn Paige Harden.
SAT scores show a similar progression when averaged by the highest level of parental education. In California in 2023, they rose from 908 (no high school diploma) to 986 (high school diploma) to 1041 (associate degree) before a big jump to 1180 (Bachelor’s degree) and 1268 (graduate degree).
The R-squared for the relationship between Black adult educational attainment and the proficiency rate of non-disadvantaged Black students was lower at 0.341. One reason the R-squared was lower is that there were fewer datapoints available (33 vs 102). Another is that the range of educational attainment values was smaller. The percentage with at least a Bachelor’s degree ranged from 13% to 45% for Black adults as opposed to 11% to 88% for White adults.
I avoid big multiple regressions because I’m not trying to produce a publishable statistical analysis. I’m trying to tell a complex story with numbers and I don’t want to put off readers by burdening it with even more numbers. I’m conscious that there may already be too many.
The composition of the two or more race group is not broken down in education data. We know from census bureau data that people of Two or More races are 50% more likely to be White-Asian combinations in San Francisco than elsewhere in California but it’s tricky to compare census bureau and education data on this topic for multiple reasons: about half of Hispanic and Latino people identify as of Two or More races (usually White and Some Other Race) in the census but will be Hispanic or Latino in education data; many Two or More race students have parents who are of one race (e.g. one Asian parent and one White parent) and the census bureau doesn’t break out the composition by age; we don’t have data on the education level of adults of two or more races.
We had statisticians at work who said we could not ask a grantee to explain racial differences if the number for the group was less than 30. That was a rule of thumb. I noticed, however, that our statisticians did not always follow their own rules.
I don’t know about Compton and Inglewood but in SF teachers are prevented or discouraged from disciplining students. Called racists if they do. Part of the popularity of charters in the Black community is that charters will suspend or expel students.
I found most of this article very interesting and helpful but you loose me when you speak about genetic variants and education. There is no logic in saying that a Latino couple who grew up in poverty and had no access to high school let alone college, no parents or other educated figures in their lives, didn’t achieve many educational years due to their lack of good genetic variants and so didn’t pass them on to their kids. Logic suggests other lacks were more important in their lack of education. Nor do we have as clear an understanding of genes and their roles as your imply. It’s also puzzling that you leave out even the possibility of racism. It’s one thing to say there are these other plausible possibilities etc. (helpful!) and another to cover various possibilities without once mentioning that studies find that we all still hold stereotypes and assumptions and it’s inevitable that many teachers and school staff might hold strong negative views towards certain races.