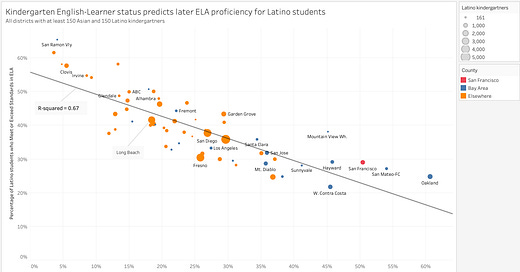
Last week’s post about English Language Learners ended with a chart showing that the Latino student population in San Francisco and other Bay Area districts contained more novice English learners than other districts. Does this have an impact on SBAC scores? Yes. Figure 1 shows the relationship between SBAC ELA scores and the percentage of Latino kindergartners who are novice English learners.

Only 29% of San Francisco’s Latino students meet or exceed ELA standards but that is actually better than the 23% that would be expected given that 50% of San Francisco’s Latino kindergartners are English novices. Even perennially hapless Oakland, where only 25% of Latino students meet or exceed standards, outperforms expectations in this way. At the other end of the scale, the astonishing performance of Latino students in Clovis (58% meet or exceed ELA standards) can be attributed in large part to the fact that only 6% of those students started out as English novices. Meanwhile, Long Beach, where 42% of Latino students score as proficient in ELA, actually underperforms because its Latino students start kindergarten with much higher levels of English fluency.
The strength of this relationship (R-squared = 0.67) amazed me. SBAC tests are taken by kids in grades 3-8 and grade 11. The idea that so much of the variability from district to district could be explained by something that can be observed in the first month of kindergarten, four to twelve years before the students take those SBAC tests, is mind-boggling. For one thing, it ignores all the other factors that we know affect student achievement including levels of socioeconomic disadvantage and parental education, as well as the quality of the actual teaching students receive over those four to twelve years.
It turns out that I was lucky to obtain such a high r-squared. The chart is restricted to those districts that have at least 150 Asian and 150 Latino kindergartners because we’re going to be looking at the performance of Asian students as well and I wanted to have the same districts for both analyses which requires excluding districts with few students from either group. However, there are lots of districts with fewer than 150 Asian kindergartners, including some large ones like Bakersfield City. If we include all of them, the r-squared drops to 0.44 because there are districts that do much better or worse than the simple linear regression would suggest. For example, Mendota Unified is a small 3,000 student district in Fresno county. Its student population is 98% Latino and over 80% of them are novice English learners in kindergarten. Nevertheless, 38% meet or exceed ELA standards, far above the 13% that would be predicted (or San Francisco’s 29%).
Asian Students
Figure 2 shows the same relationship for Asian students: the more novice English learners among the Asian students, the lower those students do years later on SBAC tests. San Francisco lies slightly above the trend-line. 70% of its Asian students meet or exceed ELA standards, a couple of points above what would be expected for a district where 33% of the Asian students are English novices.

The R-squared is 0.34, considerably lower than the 0.67 for Latino students, mainly because there are quite a few Central Valley districts where Asian students do much worse than the regression model predicts. I suspect the R-squared would be quite a bit higher if I were able to adjust for the language groups spoken. In the districts that outperform what the simple linear regression model would suggest (e.g. Irvine, Garvey Elementary, Etiwanda Elementary), the Asian students primarily speak Mandarin or Cantonese. In the districts that underperform what the model would suggest (e.g. Fresno, Lodi, Twin Rivers), they speak other languages. In Fresno, the Asian students primarily speak Hmong; in Lodi, they are roughly evenly distributed among Hmong, Punjabi, Vietnamese, and Pashto; in Twin Rivers, they speak Hmong, Pashto, Farsi, and others.
Incidentally, if I remove the restriction that districts have at least 150 Latino kindergartners, the comparison set expands to include a bunch of other Bay Area districts (e.g. Dublin, Pleasanton, Cupertino, Milpitas, Palo Alto) that combine high achievement with low novice English learner rates and the r-squared rises to 0.38, close to the 0.44 I found for Latino students. This suggests that 40% is a reasonable crude estimate of the proportion of the variability we observe in Asian and Latino proficiency rates that is due to incoming language proficiency.
San Francisco Schools
I attempted to replicate this analysis at the school level in San Francisco but the results turned out not to be very robust: the inclusion or exclusion of a couple of outlying results affected the results dramatically. For Asian students, the R-squared was 0.61 if I included Lee (the newcomer school) and 0.17 if I excluded it. For Latino students, the R-squared was 0.54 if I included Alvarado and Webster and 0.24 if I excluded them. I suspect the reason for the fragility is my (methodologically dubious) attempt to relate the English proficiency of kindergartners to the SBAC results of different 3rd-5th graders. At the district level, the kindergarten English proficiency won’t vary much from year to year but a school that averages twenty Latino kindergartners might have 50% of them be English novices in one year and 70% the next year. The novice English learner rate among the kids sitting the SBAC might thus be quite different from the novice English learner rate among the current crop of kindergartners, thereby introducing a lot of noise. A more robust way to do the analysis would be to take into account the actual initial English Learner status of each of the students who sat the SBAC at each school. Sadly, I don’t have that data.
Implications
There is a strong tendency to give districts credit or blame for things that are beyond their control. Of the 50 largest school districts in California, the ones with the highest average proficiency rates on SBAC tests are San Ramon Valley (based in Danville) and Fremont and the ones with the lowest are Bakersfield City and Stockton. Are San Ramon Valley and Fremont superbly-run districts with wonderful teachers while Stockton and Bakersfield are poorly-run districts with terrible teachers? Or did they just get lucky and unlucky in the mix of students who happen to live in their districts?
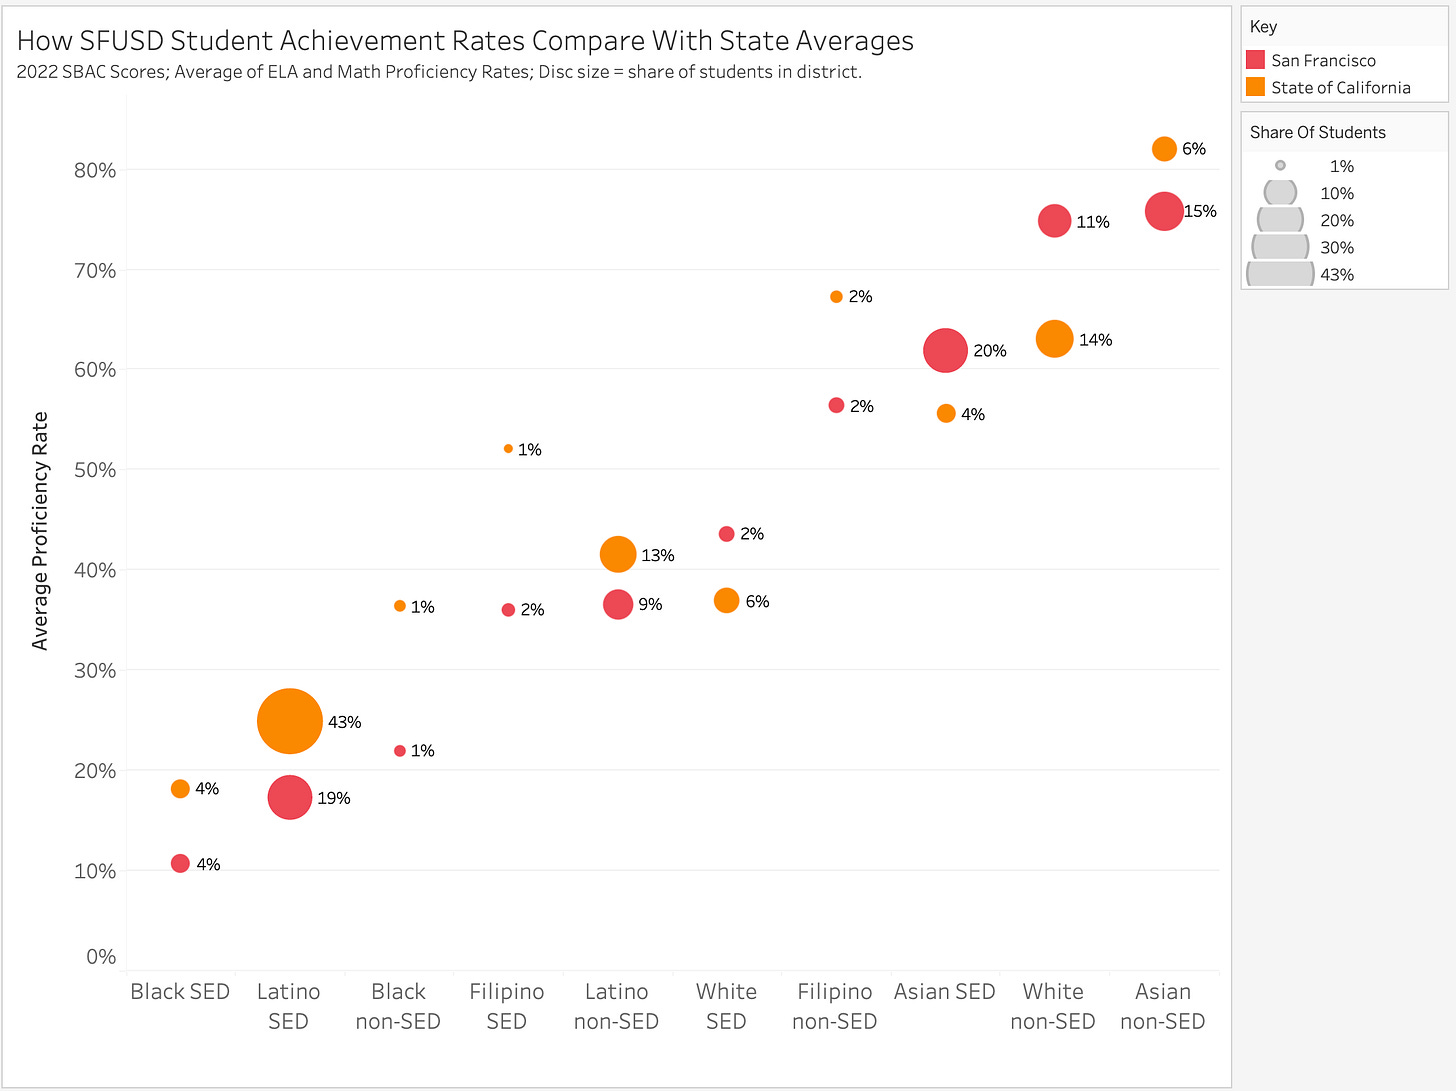
This same tendency prevails in discussions about San Francisco Unified. In a good district, we’d expect every student group to do well and in a bad district we’d expect every group to do poorly. That’s not what we see in San Francisco. Figure 3 shows how students from different groups do in San Francisco and in the state as a whole. The red discs are for San Francisco and the orange ones for California. The size of the disc represents the size of the group: socio-economically disadvantaged Latino students (“Latino SED”) students comprise 43% of the state but only 19% of San Francisco. The position on the y-axis is the average of the math and ELA proficiency rates of the students from that group. The average proficiency rate for the state’s Latino SED population is 25% compared to just 17% for San Francisco’s. That’s bad. Non-disadvantaged Latino students also do worse in San Francisco than statewide. On the other hand, non-disadvantaged White students score about ten points better in San Francisco than their peers statewide. The story is mixed for Asian students: disadvantaged Asian students do better than the state average but non-disadvantaged Asian students do worse.

It’s tempting to lay this all at the feet of the district. People will say things like “SFUSD works well for White students but not for Latino students” and the implication is that the district’s policies are to blame for the observed outcomes. But the worst performing group in San Francisco, relative to its peers, is not the Latino or Black students but the Filipino students1 and I have not heard anybody ever allege that SFUSD is particularly biased against Filipino students2. The strange pattern we see in San Francisco’s results can, however, be at least partly explained by factors outside the district’s control:
Latino student populations differ from district to district. As we’ve seen, San Francisco has far more English novices among its Latino students than other districts do and this alone may be the reason why SFUSD’s Latino students do worse than Latino students in other districts.
Asian student populations differ from district to district. As we’ve seen, when we adjust for the number of English novices among them, San Franciso’s Asian students do about as well as would be expected. It’s even possible that the comparative over-performance of San Francisco’s socioeconomically disadvantaged Asian students may be explained by language mix if it is true that Cantonese speakers score higher than than Hmong, Khmer, and Pashto speakers (e.g. because their parents are better educated) and the latter are disproportionately more represented in the state’s SED Asian population. I don’t have the data to test that particular hypothesis, however.
White student populations differ from district to district. We know from the census that San Francisco’s White adults are more likely to have college degrees than the White adults in any other California county and we’ve already seen that parental education is a big predictor of student outcomes. So it is to be expected that non-disadvantaged White kids in San Francisco will do better than non-disadvantaged White kids elsewhere in the state because a higher proportion of their parents will have college or postgraduate degrees.
Filipino SED students perform 16 points worse in San Francisco and Filipino non-SED students perform 11 points worse in San Francisco.
Except me, I suppose. In this discussion about school funding, I pointed out that schools with lots of struggling Filipino students (i.e. Carmichael, Longfellow) get substantially less money per student than schools with similar numbers of struggling Latino or Black students.


It's a simple as Facing Reality by Charles Murray.