

Elementary School Class Sizes
SFUSD has among the smallest class sizes in California
Sources of Class Size Data
When I last wrote about class sizes, I relied on a database of course enrollment records that showed every class in every school, what course was being taught in that class by which teacher, and the grade, gender, and ethnicity of every student in the class. Unfortunately, the CDE stopped publishing that data in 2018-19. The only publicly available data now are the Student Accountability Report Cards (SARCs) published annually for each school. These contain summary information about average class size by grade (for elementary schools) and subject area (for middle and high schools) that we can use for comparisons.
First, let’s look at the data that is in a SARC and point out some of the challenges in interpreting the data.
Standard Model
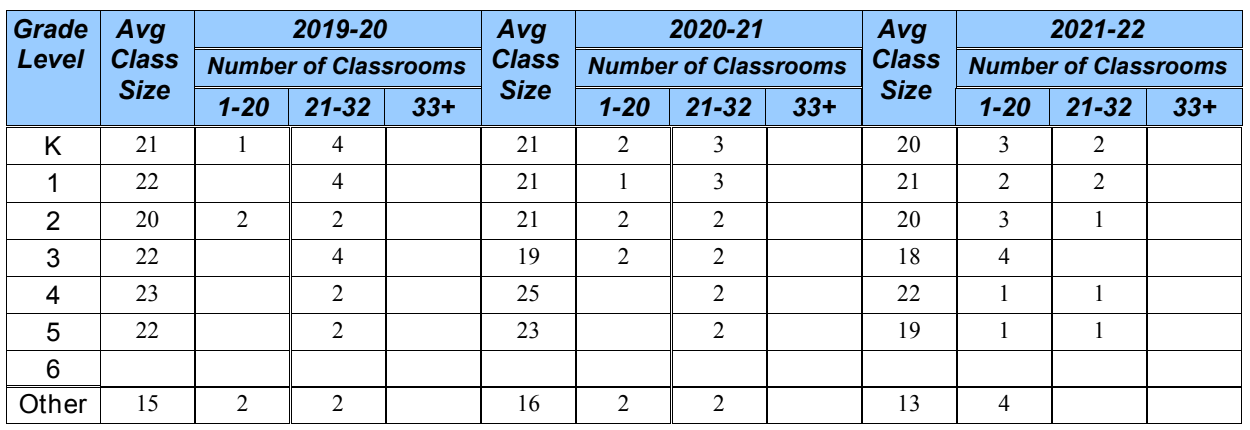
Here, from its SARC, is the class size distribution table for Commodore Sloat elementary. (Sloat’s website claims that it is in Lakeside. Realtors would tell you that it’s actually on the east side of Junipero Serra in Balboa Terrace).

As we can see, Sloat has 3 classes per grade in grades K-3 and 2, much larger, classes per grade in grades 4-5. SFUSD caps classes in grades K-3 at 22 students and classes in grades 4-5 at 33 students. Sloat was thus close to fully enrolled in 2019-20 and 2020-21 but saw a loss of students post-pandemic in 2021-22.
There are a couple of sanity checks one can do with these numbers:
If you multiply the number of classrooms by the average class size, you’d expect to get the actual enrollment (or close to it given that the average class size is rounded to a whole number). This rarely comes out exactly. The enrollment implied by the class size data is 63, 51, 60, 60, 64, 58 in grades K-5 respectively for a total of 356 but the actual enrollment in grades K-5 was 63, 57, 64, 62, 65, 60 for a total of 371. It’s not clear where the other 15 kids are but this is actually a fairly close result.
Elsewhere in the SARC, there is a section called Teacher Preparation and Placement, which shows the credential status of all the teachers. This section says the total number of teaching positions in the school was 15.3 in 2021-22. But if you add up all the classrooms in the figure above, you get 16. How can there be more classrooms with students than there are teaching positions? Nevertheless, the discrepancy at Sloat is minor compared to other schools.
Schools With Multiple Programs
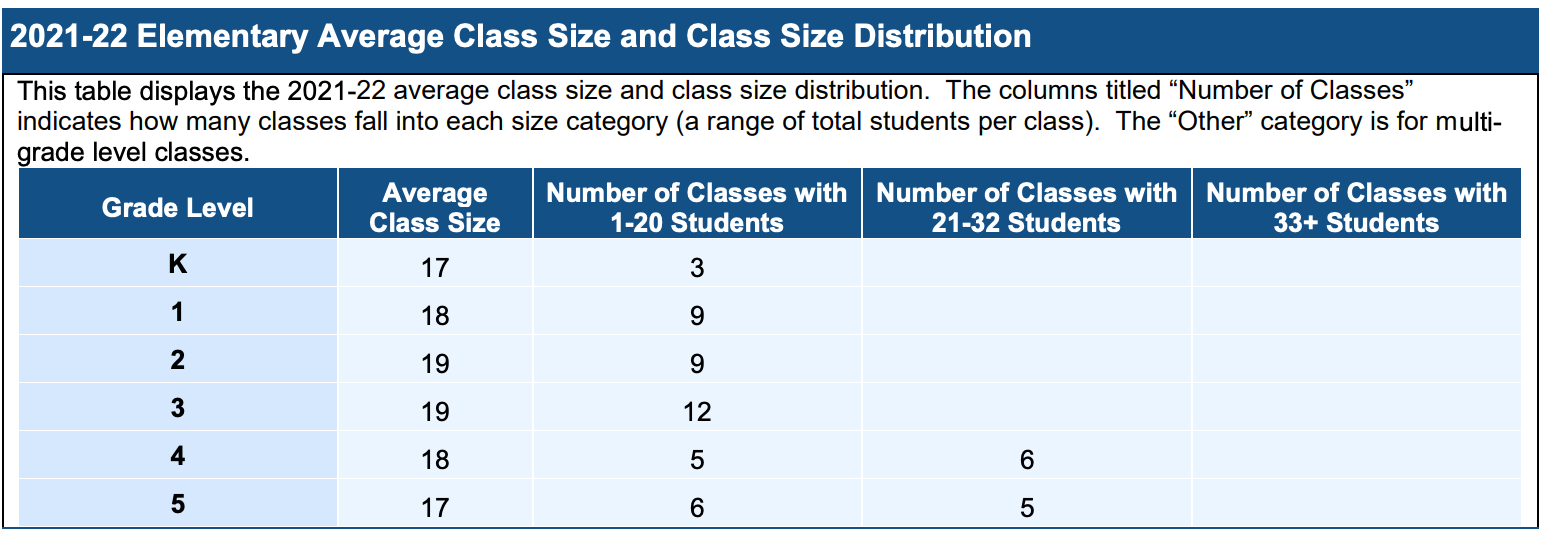
Below is the class size distribution for John Muir Elementary in Hayes Valley.

The K-3 class sizes are particularly small because the school was staffed to have two GE classrooms and one Spanish bilingual classroom per grade but enrollment was at 50% of capacity in kindergarten and 1st grade. When the district cut capacity at the start of 2022-23, it wasn’t surprising that John Muir lost one of its GE classrooms because there’s no point in staffing for students who aren’t there.
Nevertheless, an opportunity has been lost here. Remember that when I wrote about the (non-existent) effect of school size on student growth, I used student growth scores to compare schools of different sizes. Recall that a school’s growth score was calculated by comparing its students’ actual SBAC scores in 4th and 5th grades with what was predicted for those students based on their 3rd and 4th grade scores the preceding year. In the one year for which the growth scores were calculated (2018-19), John Muir’s scores were not just by far the best of any school in SFUSD but also by one measure1 the best in the entire state of California. It’s a shame that the school couldn’t attract more students. And who knows if those excellent 4th and 5th grade teachers are still there five years later?
In Muir’s case, the enrollment implied by multiplying the average class size by the number of classrooms actually comes out to be very close to the actual enrollment (220 implied vs. 225 actual) but the total number of classrooms (16) is less than the total teaching positions (14.5) in the SARC.
Mixed-Grade Classes and Special Day Classes
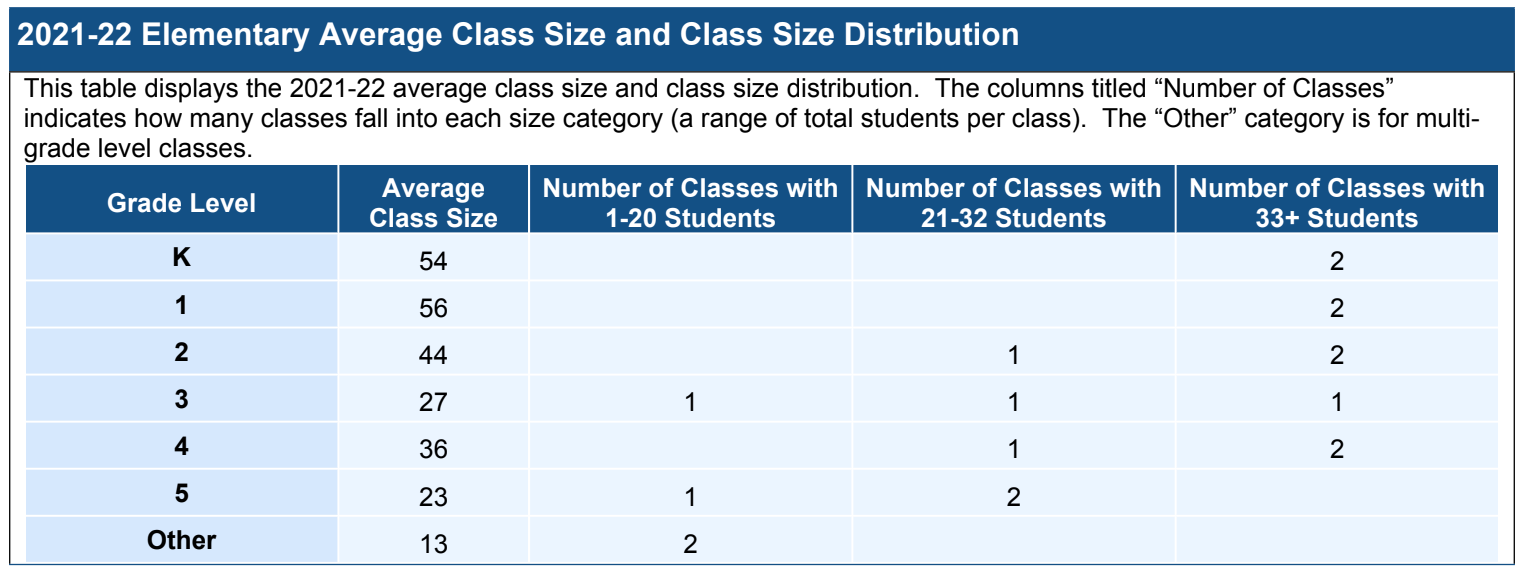
Here’s the class size data for Alvarado Elementary in Noe Valley. Note that its class sizes in grades 4-5 are no bigger than those in grades K-3, and it has four “Other” classes whose average size is only 13.
Alvarado has two General Education (GE) classes and two Spanish immersion classes in grades K-3. I believe the fifth class in kindergarten is a transitional Kindergarten class.
Since GE and immersion students can’t be put in the same class, Alvarado is effectively two separate schools, each with two classes per grade in grades K-3. In such schools, the district typically ends up offering one 4th grade class, one 5th grade class, and one class that includes both 4th and 5th grade students. I suspect that two of the “Other” classes are those blended 4th/5th grade classes.
Alvarado offers special day classes for those with moderate/severe autism. I suspect that the remaining two “Other” classes are mixed-grade special day classes.
The numbers fit this explanation. Just multiplying the number of classrooms by the average class size would imply that, in 2021-22, Alvarado had 100, 84, 80, 72, 44, and 38 students in grades K-5 respectively and then 52 “other” students for a total of 470. The actual numbers were: 103, 86, 82, 77, 67, and 57 students in grades K-5 respectively for a total of 472. The implied numbers are a tiny bit lower than the actual numbers in the early grades because of the small number of students in special day classes and a lot lower in grades 4-5 because many of the 4th and 5th grade students are in the “Other” classes.
Again, the number of classrooms exceeds the number of teaching positions. Alvarado had 25 classrooms but only 22.5 teaching positions.
4th and 5th grade mixes are not the only type of mixed-grade class found in the district. Some schools are so small (e.g. Lee (30 students), Mission Education Center (51), El Dorado (125), SF Public Montessori (121), and Cobb (132)) that they require mixed-grade classes even in the early grades. Cobb had 41 kindergartners, enough for two full kindergarten classes (but it had three classes of 14 instead), but it had only 8 5th graders.
Comparing Class Sizes across SFUSD
The existence of the mixed-grade classes (designated as “Other” in the SARCs) complicates the computation of a school average class size. If you include the “other” grade classes, whether or not a school has special day classes will greatly affect its average. If you don’t include the “other” grade classes, you’ll hardly have any data for some of the smallest schools.
Figure 4 below is a histogram of the average class size in SFUSD’s elementary schools. This includes kids in “other” grades. For K-8 schools, the data for grades 6, 7, and 8 are ignored.

The two newcomer schools have by far the smallest class sizes. These tiny class sizes are less a reflection of the greater needs of newcomers and more a reflection of the huge drop in the number of newcomers after the pandemic. Mission EC had 194 students in 2019-20 but only 51 in 2021-22 (it subsequently rebounded to 141 in 2022-23).
Even ignoring those two, there is enormous variation from school to school. As a general rule, the schools with the smallest class sizes are the under-enrolled schools in the eastern side of the city. Carver, El Dorado, and Parker each had under 200 students while Muir had 225 and Spring Valley 241.
Figure 5 is another view that compares the average class size in grades K-3 with that in grades 4 and 5. This grade division makes sense because the maximum class size changes in 4th grade.
Thirteen schools don’t appear on this chart because they don’t have any dedicated 4th or 5th grade classes. Those include some of the really small schools but also several with over 300 students such as Miraloma, Webster, Grattan, and Flynn (which had 426 students). Glen Park and El Dorado do appear on the chart but their numbers for 4th and 5th grade are obviously garbage. According to Glen Park's SARC, its 50 5th graders were organized into two classes with an average size of 72 (sic). El Dorado really did report that it had one 5th grade class with one student in it. The other 5th graders were presumably in mixed-grade classes.

SFUSD limits K-3 classes to no more than 22 students but the actual average is just over 17. It limits 4-5 classes to 33 but the actual average is under 23.
While there’s clearly a correlation between K-3 class size and 4-5 class size, it is easy to find pairs of schools that have similar K-3 class sizes but very different 4-5 class sizes. Consider Sanchez (in the Castro) and Stevenson (in the Sunset), which had similar K-3 class sizes (20.0 vs 19.75). Sanchez is a considerably smaller school (49 4th graders and 59 5th graders compared to Stevenson’s 69 4th graders and 99 5th graders) but Sanchez had three 4th grade classes and four 5th grade classes whereas Stevenson had two 4th grade classes and three 5th grade classes. In short, Stevenson had more students in fewer classes which explains how its 4-5 average (31.5) is more than twice Sanchez’s (15.0).
Having half-empty classes is a waste of resources. To save money for other purposes (like salary increases!), SFUSD needs to ensure that classrooms are full. That means getting rid of half-empty classes. To its credit, SFUSD says it eliminated about 100 classrooms in 2022-23. I would expect the class size distribution for 2022-23 (when it is available) to show much less variation in class size.
Comparison with Other Districts
Data Cleanup
Comparing class sizes across districts is not easy because districts have different ways of defining what a class is. In San Francisco, elementary school kids are generally enrolled in one and only one class. They may get lessons in art or music or PE but those do not show up in the system as separate classes. Some other districts don’t follow the same approach and this makes comparisons problematic.
As an example, here’s the class size distribution at Thousand Oaks Elementary in Berkeley where the number of students per grade ranges from 51 (in 4th grade) to 64 (in 5th grade). Despite what the SARC says, the 51 4th graders are not organized into 11 separate classes each with an average size of 18. Nor did enrollment triple between kindergarten and 1st grade.
I’m not sure what’s going on at Roosevelt Elementary in Long Beach but I’m willing to bet its 124 kindergarten students are not really divided into 14 classes of 9 students each when the class sizes in the other grades are between 22 and 27.

A final example: Shore Acres Elementary in Mt. Diablo Unified only had 56 kindergarten and 61 1st grade students so it’s implausible that they’re organized into two classes of size 54 and 56 respectively.
Most baffling of all is Palo Alto, where the data that CDE reports bears no resemblance at all to the data in the SARCs published by the schools.
To facilitate any sort of cross-district comparison, I needed a way to exclude schools like these where the data seems suspect, or at least not comparable to San Francisco’s. Here’s what I came up with:
Exclude all schools where the implied enrollment (i.e. the average class size multiplied by the number of class sizes) is not within 10% of the actual enrollment.
Exclude all schools where the implied number of teachers (i.e. the total classroom count) is not within 20% of the total number of teaching positions at the school. (A bigger tolerance seems appropriate because the number of teachers at a school is much lower than the number of students).
We’re still left with thousands of schools in the sample set. Here’s a histogram of their K-3 class sizes. It’s clear that nearly all of SFUSD’s schools have a class size lower than the state average.

Instead of showing individual schools, we can compute district-wide averages. Figure 10 below shows the average K-3 and 4-5 class sizes in all the districts that have at least 3,000 students in elementary schools. Some districts (e.g. Clovis, San Jose, Palo Alto) are missing from the chart because most or all of their schools get excluded by one of the criteria outlined above.

Why does average class size vary so much?
Class size is a function of both policy and practice.
On the policy side, districts set a maximum class size. In San Francisco’s case, that’s 22 in K-3 and 33 in grades 4-5. Other districts set higher maximum class sizes. For example, Long Beach’s maximum is supposedly 24 in K-3 and 35 in 4-5 but as figure 9 showed, some schools had K-3 classes bigger than 24.
On the practice side, districts vary in how efficiently they allocate students to classes i.e. how close they come to filling each class.
Districts have to staff schools based on enrollment. In districts where school assignment is based on residence, districts have no control over how many students are entitled to attend each school. If overall enrollment is declining, every school may be seeing a decline which will lead to half-empty classrooms in every school.
SFUSD has the same level of uncertainty about overall enrollment as other districts but the uncertainty is not distributed in the same way. In San Francisco, open enrollment allows parents to apply to any school in the district but some schools are more popular than others. Even if overall enrollment falls, schools like Claire Lilienthal and Sunset will still be full. Any drop in enrollment is going to be concentrated in the low demand schools. In theory, these parental preferences should enable the district to be more efficient about staffing classrooms than other districts because there are fewer schools with enrollment uncertainty and thus fewer schools that need a staffing buffer. In reality, its plethora of small schools, and policy of mixing general education and language programs in the same school, lead to very inefficient class staffing.
Class Size and Student Learning
When I wrote about the effect of school size on student learning, I used the CDE’s growth scores to show that there was no link. I was sorely tempted to use the same method to look at the effect of class size on student learning but there are a whole bunch of data issues to be solved (e.g. growth scores are only available at the school level, not at the class level) and I’m sure there must be a score of statistically-capable education PhD students looking at that exact topic.
Of course, the effect of class size on student learning has been studied all over the world for decades. California has been the subject of a bunch of the studies because of an experiment in K-3 class size reduction that started in the 1990s a quarter century ago. Here’s a fun SF Chronicle article from 1996 talking about the implementation of the class size reduction initiative in the city, which included the opening of Sunset Elementary (now one of the most popular schools in the city but a scene of chaos on its opening day). I was struck by one teacher’s comment that her class went from 34 to 22, which really was a huge change.
This Brookings paper gives a non-academic overview of the research on class size, my one sentence summary of which is that an individual teacher will obtain better results with a smaller class than a larger one but reducing class sizes means hiring lots of inexperienced new teachers whose students will do worse than they would have in a larger class with an experienced teacher. A recent paper I read argued that class size reduction in California did pay off, in part because the smaller class sizes attracted students who would otherwise have gone to private schools. Here’s a non-academic review of that paper. Suffice it to say that it is a complex issue that depends on your starting point (the higher your initial class size, the bigger the return you’ll get from any investment) and the local economic situation (the higher your pay is compared to other jobs in the region, the easier it’s going to be to find new teachers).
Consider the following observations:
SFUSD’s elementary school class sizes are among the smallest in the state
Despite the small class sizes, SFUSD’s SBAC results are not outstanding, especially for Latino and Black students.
SFUSD has trouble hiring enough new teachers every year.
SFUSD has more early-career teachers than most other districts
Students taught by early-career teachers do worse than students taught by experienced teachers.
I think those observations are each fairly uncontroversial. Here comes the controversial bit:
Would SFUSD’s elementary school students, on average, be better served if the class sizes were higher? Suppose the average K-3 class size increased from 17 to 20 over a couple of years. 20 is still considerably smaller than the state average. The average quality of teachers in the district would increase not because any individual teacher is better but because there would be fewer new inexperienced teachers. Would that increase in teacher quality outweigh the increase in class size?
It is important to note that increasing the class size wouldn’t require teacher layoffs. Since enrollment is not forecast to increase, it would require consolidating classrooms and probably closing some schools. For a couple of years, teachers who leave would not be replaced, and teachers who stay would be shuffled to where they’re needed. It may or may not be necessary to increase the maximum class size from 22 to 24 in order to get the average up to 20.
I write all these things as if the district has a choice. Its structural budget deficit may push it in this direction anyway whether it thinks it would on balance be good or not.
John Muir had the highest average growth score (135.9 in ELA and 145.6 in Math) among the thousands of schools for which the district’s preferred growth score calculation method could be used. The only caveat worth mentioning is that Muir had only 58 students with growth scores and, of course, the smaller the size of the school, the more likely an extreme score is due to statistical fluctuation. But, still, you can’t do better than being the best.
The perils of not keeping up with the literature!! thank you -- did not know about this work. I also agree with all the complex effects of class sizes such as changes in admissions that you outline. I dont think much of the literature considers these channels anyway, but IMO they are likely to be important.
neat article!! my favorite data on the subject comes from this cool paper:
https://academic.oup.com/qje/article-abstract/114/2/533/1844228