Everything is Relative in UC Admissions
Why are Mission High students so successful at getting into UCs?
A recent SF Chronicle story and accompanying graphics about UC admissions drew a lot of comment. Particular attention was paid to the success of Mission High whose students gained admission to UC Berkeley not only at a far higher rate than students of Lowell High, but at a higher rate than any other high school in the state. In this post, I want to explore some factors that might explain what’s happening.
One reason why this article attracted so much comment is that Lowell students are, by any measure, far more academically successful than Mission’s.

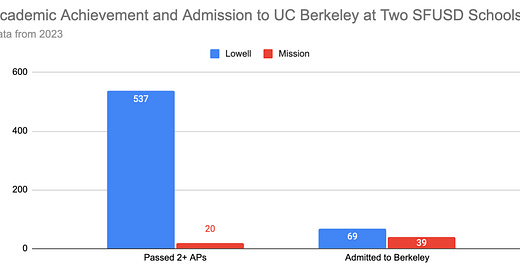
537 Lowell students passed at least 2 AP exams but only 69 of them were admitted to UC Berkeley. Only 20 Mission students passed at least 2 AP exams but 39 Mission students were admitted to UC Berkeley. Students who would not rank in the top 550 at Lowell (there were 678 students in Lowell’s graduating class) are getting admitted to Berkeley if they come from Mission. What is going on?
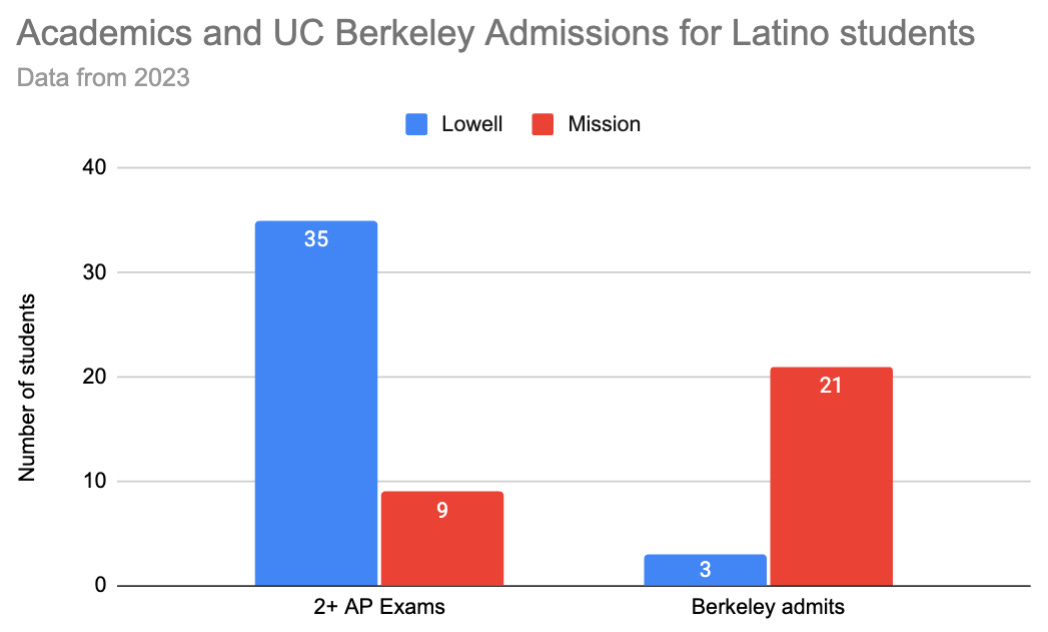
The majority of Lowell’s students are Asian; the majority of Mission’s students are Latino. The UCs are prohibited by law from considering race or ethnicity as a direct criterion in admissions. Indeed, the differential treatment of the two schools exists even if we focus purely on Latino students. 35 Latino students at Lowell passed at least two AP exams but only 3 were admitted to UC Berkeley. Meanwhile, 21 Latino students from Mission were admitted even though only 9 passed at least two AP exams.

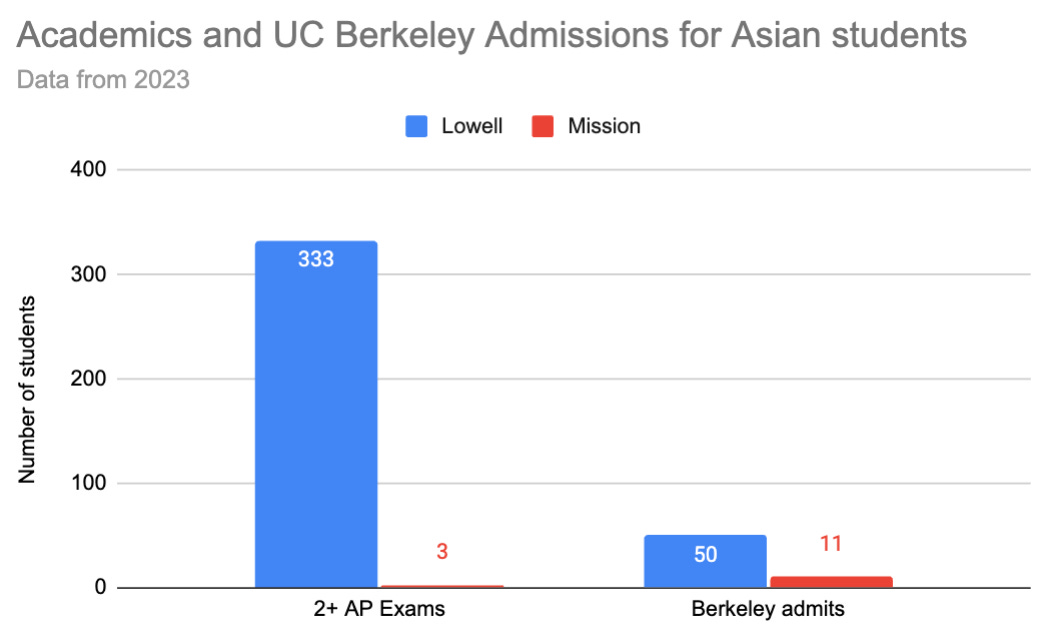
The differential treatment also exists if we focus just on Asian students. Only 3 of Mission’s 34 Asian students passed 2 or more AP tests. Nevertheless, 11 were admitted to Berkeley. Meanwhile, Berkeley admitted fewer than one-sixth of the 333 Asian students at Lowell who passed at least two AP courses.

The exact numbers vary but the basic story is consistent from year to year: Mission High students do surprisingly well in UC admissions even after adjusting for race and ethnicity. Let’s explore some reasons why.
Evaluation in the local context
Although it is illegal to consider race or ethnicity as a factor in admissions, admissions offices care very much about the racial/ethnic mix of the students they admit. Many people (e.g. politicians, political activists, academics, newspaper pundits, online commentators) who review admissions statistics care very much about that topic too. Whenever any change to admissions policies is proposed, that proposal is evaluated based on its impact on the mix of admitted students.
Admissions offices have adapted to the legal environment by adopting race-informed policies that try to push admission statistics in the desired direction without explicitly mentioning race. Exactly how far they can and should go is the subject of heated debate and ongoing court cases. One policy that is on legally solid ground is to do as the UCs do and evaluate students relative to their classmates. Berkeley tells students that it evaluates them based on:
“your level of achievement … relative to other UC applicants at your school.”
This policy takes advantage of the facts that most schools have geographically-defined attendance areas and that different racial groups tend to live in different geographic areas. By evaluating students relative to their classmates, admissions offices can admit fewer Asian students more students from underrepresented groups than if they evaluated all students in one big pool.
The implementation of this policy by the UCs is the primary reason for the differential treatment that we see. The Latino students at Lowell are much stronger than the Latino students at Mission (i.e. they take more AP tests; they score higher on the ones they do take; and they score much higher on SBAC tests). But the Latino students at Lowell have very little chance of getting accepted into Berkeley because they are being compared to their hundreds of even higher-achieving Asian classmates. Meanwhile, there are only a few Asian students at Mission and they don’t outshine their Latino classmates. Essentially, it’s better to be a solid student surrounded by poor classmates than a very good student surrounded by excellent classmates.
One justification for this policy is that schools in richer areas historically had more resources and offered more advanced courses than schools in poorer areas. A student in Palo Alto might have access to far more opportunities than a student in the Imperial Valley. But this argument loses salience within San Francisco which does not factor geography into high school assignments. It wouldn’t be that unusual for a Latino family to have one child who does well enough in middle school to qualify for admission to Lowell and another sibling does not and chooses to attend Mission. The more academically talented sibling may work harder, take more advanced courses, and do better on them, than her sibling but, precisely because she was ambitious and motivated enough to attend Lowell, she has a much lower chance of getting in to Berkeley than her less-academic sibling.
The system gives families perverse incentives: maximize your learning in high school or maximize your chance of getting in to a UC.
The Number and Quality of UC Applicants
Let’s broaden the discussion to other San Francisco public high schools.
The absolute minimum standard for applying to a UC is that you have a 3.0 GPA and have completed the A-G requirements i.e. achieved a grade of C- or better in a certain set of classes. Curiously, the number who’ve attained the A-G requirements is not published anywhere I could find. The CDE does publish the number who passed the A-G requirements AND met at least ONE of the following additional criteria:
scored at least Standard Met on one SBAC test and at least Standard Nearly Met on the other (e.g. Standard Met on ELA and Standard Nearly Met on Math or vice versa);
passed at least one AP exam.
attained a grade of C- or better in one semester of college coursework
completed a CTE pathway with a C- or better in the capstone course
This is not a particularly high standard. 37% of all public school students statewide fulfill these “A-G Plus” requirements. At Mission and Lowell, the figures are 39% and 87% respectively.
Success on AP exams is a more demanding standard. 21% of all public school graduates have passed two or more AP or IB exams. 7% of Mission’s students and 79% of Lowell’s pass at least two. Of course, many pass far more than two. Dozens of students at Lowell pass ten or more.
The high school population can thus be divided into three groups by academic achievement:
those who passed at least two AP tests
those who did not pass two AP tests but did meet the A-G Plus requirements
those who did not meet the A-G plus requirements
The shading of the columns in figure 4, below, shows the size of each group at each San Francisco public high school. It also shows the number who applied to (the yellow/red circles) and were admitted to (the yellow/red squares), any UC and UC Berkeley in particular.

At most schools, the yellow circle, which indicates the number who applied to any UC, is very close to the top of the light blue bar. This shows that most students who complete the A-G plus requirements apply to a UC. In fact, at Lowell, Mission, Lincoln, and Gateway, the number of UC applicants exceeds the number who’ve completed the A-G plus requirements. (Presumably these additional applicants completed the A-G part but not the plus part). On the flip side, there are dozens of students at Burton, Balboa, and City Arts, who did complete the A-G plus requirements but didn’t apply to a UC. Those schools should be encouraging those students to apply. Even if those additional students are unsuccessful, their applications might improve the chances of their classmates’ applications. (This is, when you think about it, completely ridiculous. The optimal strategy for a school is to persuade students who might have no interest in going to a UC to waste the time and money to submit applications.)
Across the city, 76% of students who apply to a UC are accepted to at least one. Mission, at 92%, has by far the highest acceptance rate. Only 9 Mission students who applied to a UC were not accepted somewhere. Meanwhile, at City Arts and Leadership Academy, only 60% of UC applicants were accepted. Compared to Mission’s students, those from City Arts come from poorer families, are more likely to have completed their A-G plus requirements, and are more likely to have passed at least two AP tests. Nevertheless, it would be a mistake to read too much into this. Acceptance rates might differ because students are applying to different UC campuses. Students from one school might have been accepted to UC Merced or UC Riverside, the two lowest ranked UCs, while students from another school might not even have applied to those campuses and might have been accepted there if they had.
The red circle and square shows the percentage at each school who applied to, and were admitted to, Berkeley. The red circle is a bit below the yellow circle for all schools because most, but not all, of those who apply to UCs have UC Berkeley as one of their choices. Unsurprisingly, those that apply to other UCs but not Berkeley are weaker students: they have significantly lower GPAs than those that do apply to Berkeley. At most SF schools, the GPA gap between the Berkeley applicants and the other students was in the range 0.18-0.32. At Mission, the 90 students who applied to Berkeley had an average GPA of 3.98 while the 24 that only applied to other UCs had an average GPA 0.66 lower at 3.32. Mission’s applicants to Berkeley benefit because of the existence of all these other weaker Mission applicants to other UCs.
Grading Standards
The most important criterion the UCs use to evaluate students is, supposedly, their grade point average. The higher the GPA, the greater the chance of admission.
Grading policies differ from school to school and from teacher to teacher. Here’s a paraphrase of a semi-reliable source (my son) explaining a class selection dilemma at his school:
There are two teachers for [subject]. Mr. X is an excellent teacher so you learn a lot but he’s also a hard grader. To get an ‘A’, you have to really master the material. On the other hand, Mr. Y is not as good a teacher but it’s much easier to get an ‘A’ in his class.
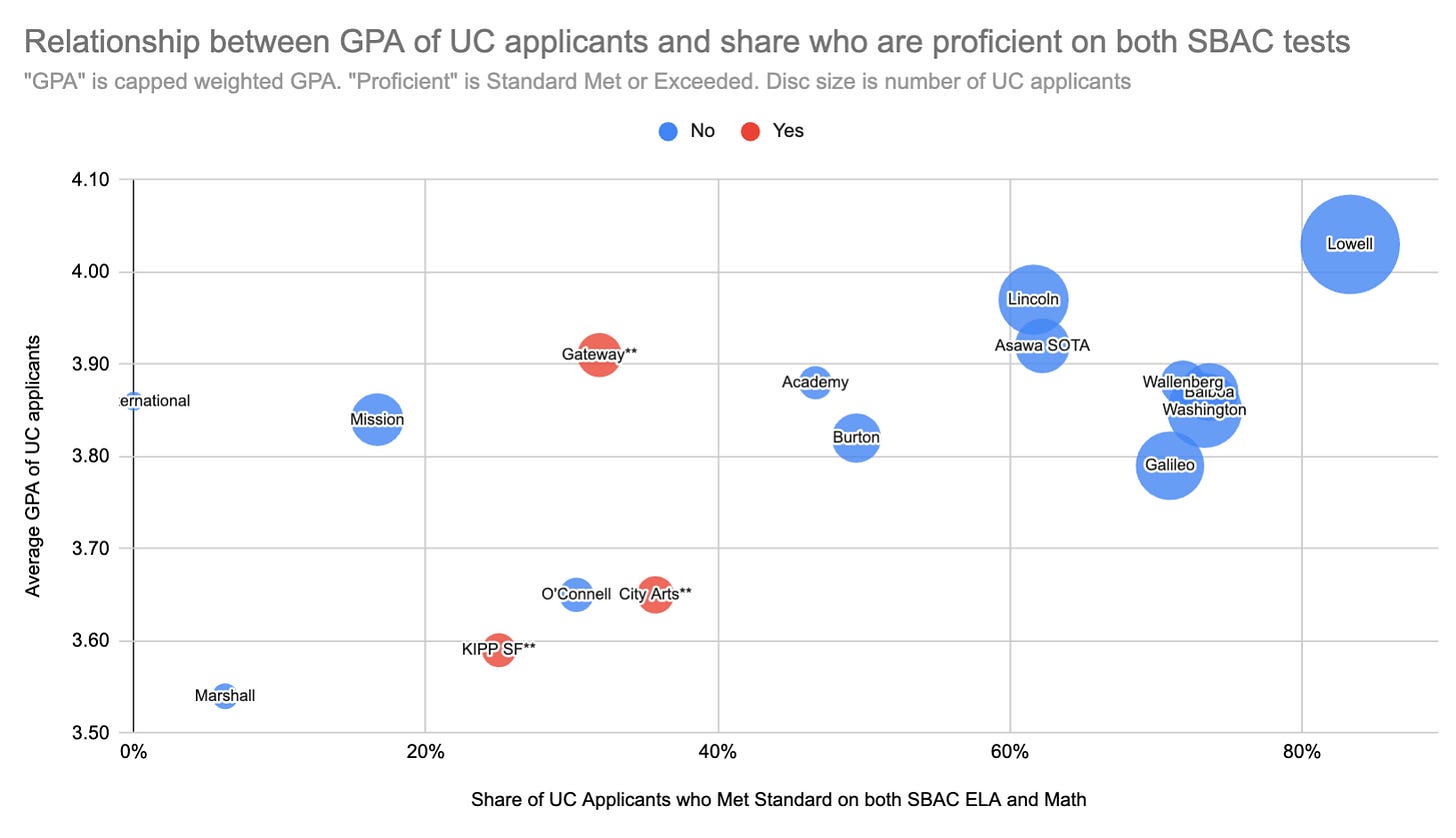
The variation in grading standards can make it hard to compare GPAs across schools. We can construct a crude gauge of a school’s grading practices by comparing the average GPA of those who apply to UCs to the share of UC applicants from the school who meet or exceed the standard on the SBAC ELA and Math tests1.
If grading standards were consistent, we would expect to see that schools which have more students who meet the SBAC standards would also have higher average GPAs. Figure X shows the data for San Francisco. Mission’s UC applicants are less likely to be proficient in ELA and Math than those at City Arts but their average GPA is 0.19 higher. 71% of Galileo’s UC applicants meet or exceed the standards in both ELA and Math, compared to only 17% of Mission’s, but Mission’s applicants manage to have higher GPAs. The obvious interpretation is that the grading at Mission is systematically easier. Lincoln and SOTA also seem to have softer grading standards than Galileo, Balboa, Wallenberg, and Washington. Among the charter schools, Gateway appears to be a much softer grader than both City Arts and KIPP SF.

It should be noted that the GPAs cited here were calculated using UC’s own ‘capped weighted GPA’ formula which limits the number of AP/Honors classes a student can get credit for to two per semester. A student taking 6 AP classes is treated the same as a student taking 2 Honors classes. In fact, the capped GPA penalizes ambitious students. If you take 6 AP classes and get five ‘A’s and one B, you end up with a lower capped GPA than if you took just two Honors classes and four regular classes and got an A in all of them. If fully weighted GPAs were published, the average GPA difference between the schools would be even greater.
Course Selection and AP Scores
Berkeley tells students it looks at “the number and rigor of courses taken” and “your planned 12th grade courses” and “your scores on AP exams”. Students often try to strike a balance between taking challenging courses and maintaining a high GPA.
Most colleges look at the grades for the first semester of 12th year. Colleges that are evaluating students early action (i.e. before the first semester is completed) often ask counselors to submit progress reports for whatever portion of the semester is completed. The UCs only have access to grades for 10th and 11th years. All they know about 12th grade is the list of courses that the student has signed up for.
For a student who is only interested in applying to public colleges, the optimal strategy is therefore to sign up for the hardest possible courses available to you because it doesn’t matter whether you do well on them. There are varying opinions on whether taking classes that may be too hard for you is a good idea. Some schools and districts expect students to meet certain qualifying criteria before signing up for advanced classes. They want their students to be successful in whatever classes they take. Other schools and districts consciously encourage students to take AP classes even if they suspect the students are ultimately going to fail the AP exams. KIPP, for example, believes that its data shows that even if a student has to repeat a course in college, the student will benefit from the prior exposure to the material. This is clearly the optimal strategy for students applying to UCs because the UCs will never even know if they fail.
The UCs do have access to the scores on AP tests taken in 10th and 11th grades. Most Mission students who take AP tests fail them. In 2019 (the last year for which we have this detailed data), Mission students took few AP tests (1.3 per test taker) and passed only 36% of the AP tests they did sit. Students at all the other comprehensive high schools in the city both sat more AP tests and passed them at a higher rate. Students at KIPP had a lower pass rate but each test taker sat more tests (1.95) than at all the other schools bar Lowell and SOTA.
Holistic Review
According to this summary of Berkeley’s admissions process:
The undergraduate admissions process at Berkeley utilizes “holistic review” for freshman applications which evaluates applicants on an equally-weighted range of both academic and non-academic factors (excluding race, ethnicity, gender, and religion).
The non-academic factors that typically get bandied about include things like leadership, persistence, passion, and a desire to give back.
These are desirable human qualities and there’s no reason to believe that they vary by race, ethnicity, gender, or religion. There may be some positive correlation between these qualities and academic achievement2 but let’s assume these factors have no association, positive or negative, with high academic scores. Individual students at a school would vary widely in their non-academic scores but schools would tend to have roughly equal numbers of students who score highly and lowly on non-academic factors. We wouldn’t see some schools having lots of high-scoring students and others having lots of low scoring students. Including non-academic factors in the admissions process would therefore change which individual students were admitted but it wouldn’t significantly advantage or disadvantage students from a particular school.
Who am I kidding? I’d be shocked if the actual scoring of the non-academic factors didn’t miraculously favor the types of students whose numbers the admissions office wants to increase. That’s literally the entire purpose of having the non-academic factors. It’s probably like the situation at Harvard where Asian applicants were systematically rated lower on personality traits.3
But, even if true, this doesn’t explain why Mission students do so well whereas students from KIPP SF and City Arts don’t get a similar admissions boost. It’s not because Mission students are particularly impoverished. 58% of Mission’s students are eligible for free or reduced-price meals. That’s higher than Lowell (37%) but it’s below the state average of 60%. Within San Francisco, it’s below Burton (62%), Balboa (also 62%), Marshall (66%), SF International (74%), and O’Connell (75%), not to mention two majority-Latino charter schools: City Arts and Leadership (69%), and KIPP (82%). There’s no reason to believe that Mission students are overcoming more personal obstacles (however you choose to define that) than those at City Arts and KIPP.
Lack of Opportunities
Berkeley also says that “all achievements, both academic and nonacademic, are considered in the context of the opportunities an applicant has had.” If your school doesn’t offer AP classes, you won’t be penalized for not taking them. But if your school does offer lots of classes, you’ll be expected to take full advantage of them. The weighted capped GPA concept is another attempt to address the same problem so the UCs could be seen to be adjusting twice for the same issue.
There was a time when AP tests were offered in only a few high schools. Now nearly every non-alternative high school in the state offers either AP or IB tests. As a smaller school, Mission doesn’t offer as many choices as larger comprehensive high schools but, as the High School Course Matrix reveals, it offers more than SOTA. An ambitious student can still take the two AP English courses, two AP Math courses (Calculus AB and Statistics), two AP Science courses (Environmental Science and Physics 1), AP CS Principles, AP Spanish, and AP Art Drawing. In some areas where it doesn’t offer the associated AP classes, it offers Honor classes (i.e. American Democracy; Economics, Ethnic Studies). The only real gap is in Social Sciences.
Choice of College and Major
Each UC campus has multiple colleges and each college has different standards for admission. If you dig around on the UC Berkeley website, and do some calculations, you can find that applicants to Engineering have a higher average GPA than applicants to Letters and Sciences (4.22 to 4.16 - these are fully weighted GPAs, not capped weighted GPAs) but their chances of admission are much lower (8.4% to 15.1%). On the UC Engineering site itself, you’ll see an admission rate of 7.1%4.
Within the individual colleges, there are “impacted majors” that will have higher admissions standards than the general college. I have not been able to find any information about the admissions standards for these majors.
It is possible that some of the observed differences in admission rates are because students from different schools are applying for different things. Perhaps Lowell students are applying to major in high demand subjects like Electrical Engineering or Computer Science while Mission students are applying to major in low demand subjects like Celtic Studies.
But that’s just a guess. No data is published that would allow anyone to analyze this.
Conclusion
The success of Mission’s students in gaining admission to UCs, and UC Berkeley in particular, defies easy explanation. They are not as academically prepared as the students from Lowell. They are not as needy as the students from City Arts and KIPP.
Mission High, as a school, does two things that appear to contribute to their students’ success in admission.
They get everyone who is eligible to apply. By expanding the pool of UC applicants, they make it possible for the better students to stand out in comparison.
They grade very generously. Students end up with much higher GPAs than other academic measures would suggest is likely.
We don’t actually know this latter number but we do know the number of students at each school who meet or exceed both standards so we can approximate the percentage of UC applicants that meet or exceed both standards by making the crude assumption that all of these students apply to a UC. Imagine a school has 100 seniors, 30 of whom meet standards in both ELA and Math. Now, imagine that 50 seniors from that school apply to a UC. We will estimate that 30/50 = 60% of the school’s UC applicants meet SBAC standards. This is a pretty good approach for San Francisco where the number of UC applicants far exceeds the number who met or exceeded the standard on both SBAC tests. It doesn’t scale so well to the rest of the state. In 2023, 116,000 public school students applied to a UC and 106,000 public school graduates had passed both the ELA and Math SBAC tests when in 11th grade. But in 2018, the last year for which I’ve seen data, only about 70,000 students who’d met or exceeded both standards applied to a UC. So roughly 30% of students who were proficient on the SBAC never applied to a UC. I haven’t studied whether these non-applicants are disproportionately distributed by geography, wealth, race, gender, or any other factor
How does persistence manifest itself if not in greater achievement?
There are lots of more nuanced criticisms one could make. Can you really discern these qualities from essays and recommendations? Can you quantify them in any reliable way? Even if you can quantify them, do they have any effect at all on college success? There are many, many studies that look at which academic factors best predict college success. I’ve not seen any that examine whether non-academic factors are any help in predicting college success.
The data behind the 8.4% number is based on three admissions cycles and the 7.1% number is for 2022-23.


I found this article to echo the situation in California. Though I haven't seen many Californians clear, that this is what is happening, called ELC here. https://www.texastribune.org/2023/06/29/texas-college-top-ten-percent-plan-supreme-court/ In my view, ELC explains a lot of the variance (to abuse a statistics term). The UC wants minorities. (Californians, in enacting Prop. 209, want race-blind merit based admissions, but the UC knows best.) Mission San Jose has a ton of college minded (and 10-15% of their students are National Merit SemiFinalists) accomplished students who apply to UC. Mission SF has fewer college minded students. It turns out that the former are Asian and the latter are minorities. So using ELC (take top 9% from each high school) the UC eagerly admits Mission SF students, and eagerly shuts out Mission SJ students. Admissions demographics would be quite different, if the UC would just admit the most qualified students statewide. All they’ve done, is weaken a nation. Asians should move to Gilroy, not Palo Alto. Though the UC would find a new way to discriminate, move the goalposts, and (continue to) hide the data.
Thanks for the very thorough analysis. Ethnic diversity is achieved at highly competitive UCs by making it much harder for students at schools with large numbers of high achieving students to get admitted to the school of their choice.