High School Class Sizes
Very different from school to school but about average compared with other districts

Several people responded to my last post by pointing out that the average class sizes in their children’s middle schools were considerably higher than the averages I was reporting. They’re almost certainly correct. Indeed, regular students in popular schools may never see a classroom with fewer than 22 kids during their middle and high school years. But those classrooms do exist. Sometimes they’re for special education kids, sometimes for English learners or kids who are behind in Math. It only takes a few of those classes to bring down the average class size.
Here is the average class size for each of the SFUSD high schools.
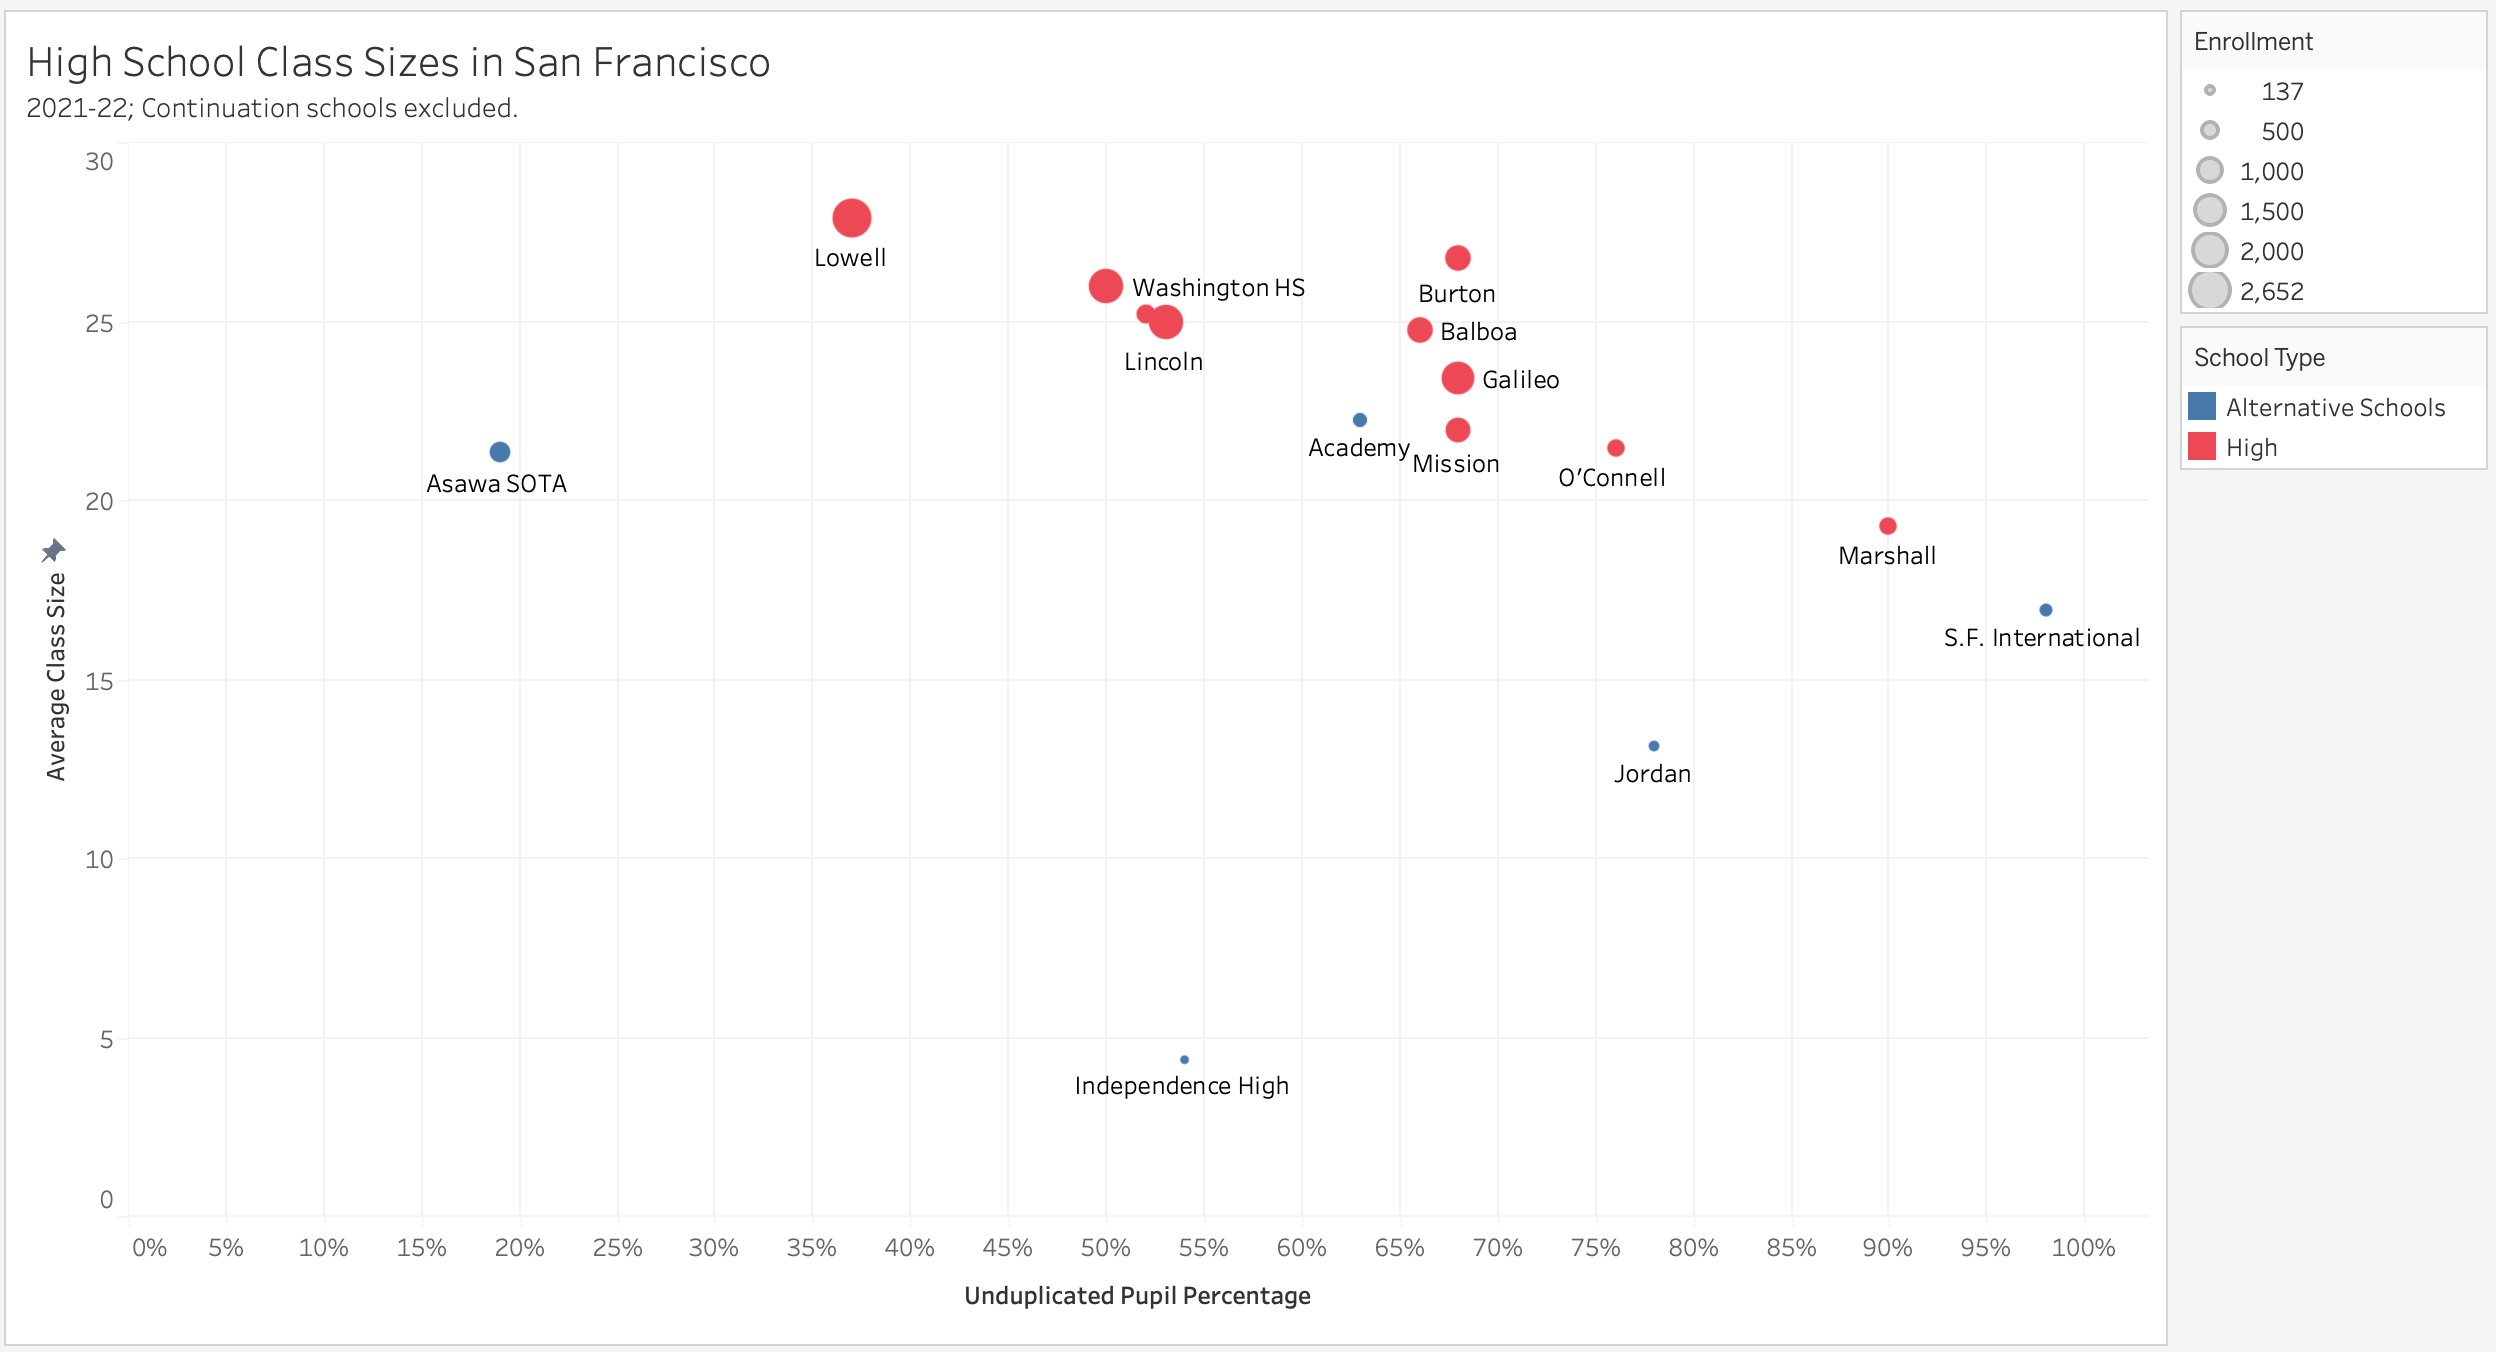
Since Independence is, as the name suggests, an independent-study school, the meaning of a “class” is going to be very different than at a more traditional school. Although the class size data may not be comparable, we know from other sources that Independence’s cost per student is way above the SFUSD average. Jordan, which is a standard in-person school, and is about as expensive as Independence on a cost-per-student basis, has class sizes that any private high school would boast of.
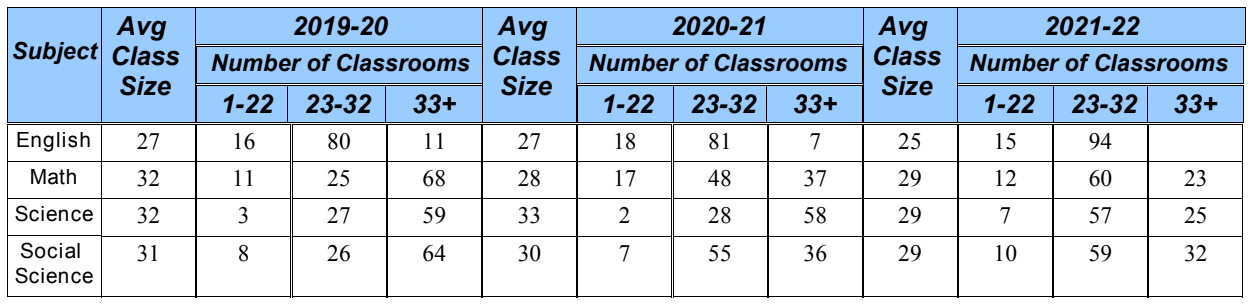
The need to show Independence and Jordan on the chart obscures the differences between the other schools. Those differences are both large and difficult to explain. For example, figure 2 below shows the class size distribution for Lowell. Most classes have a capacity over 30 but some are not full, which brings the average class size down a bit.
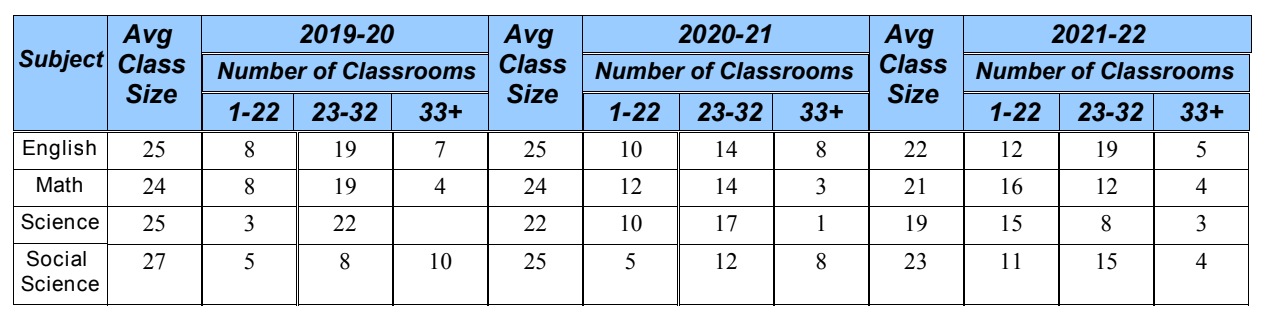
Meanwhile, here is the class size distribution for SOTA, which has an even lower unduplicated pupil percentage (a good measure of need) than Lowell. Remember that these class sizes are just for core academic areas so they don’t include SOTA’s in-depth arts programs. Notice that SOTA has far more small classrooms (22 or fewer students) than it does large ones (33 or more students).
Now let’s consider two very different schools. Figure 4 shows the class size distribution for Mission. Mission has a much higher unduplicated pupil percentage than SOTA but its class sizes are about the same.
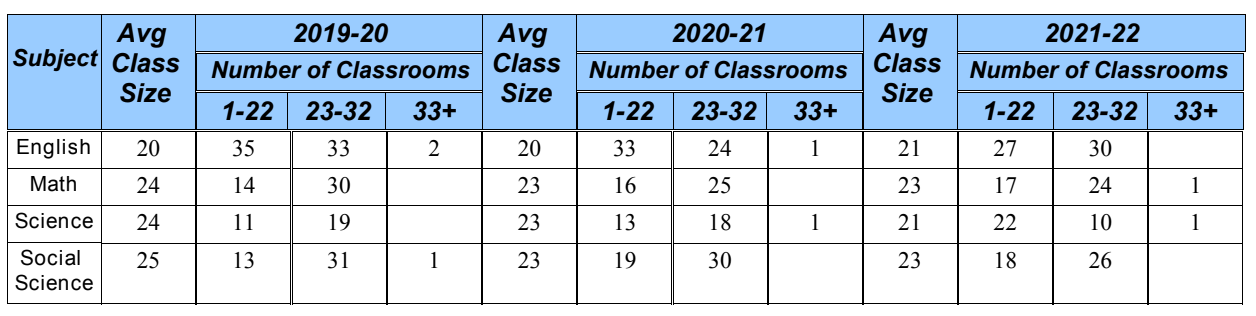
Now let’s compare Mission to Burton, which has almost the same unduplicated pupil percentage (a proxy for need) as Mission.
Burton’s distribution looks much more like Lowell’s than it does Mission’s. It has more large classrooms (i.e. those with more than 33 students) than it does small ones. If anyone can explain or justify this class size variance, I would love to learn.
It is disappointing that the recently concluded High School Task Force did not examine the issue of how high schools get funded and staffed. More generally, it did not wrestle with trade-offs in any serious way. If you’re going to recommend that the district do more of X, you have to do recommend that it do less of Y, unless the assumption is that X is free, which it never is.
Comparison to Other Districts
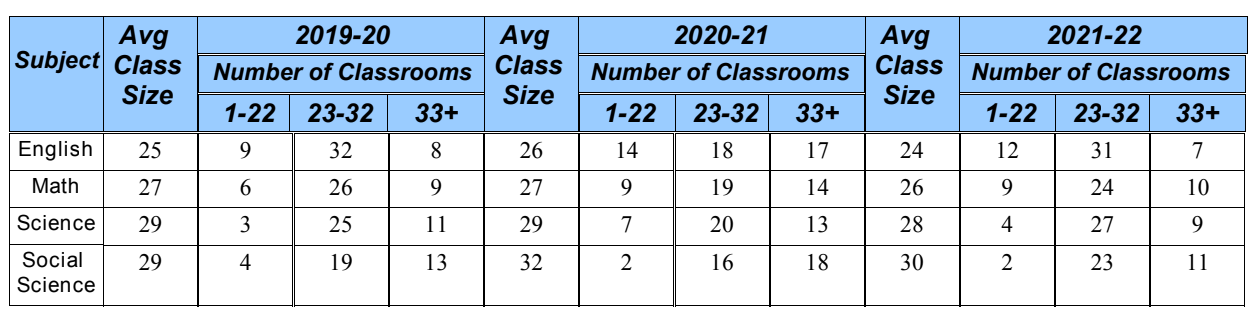
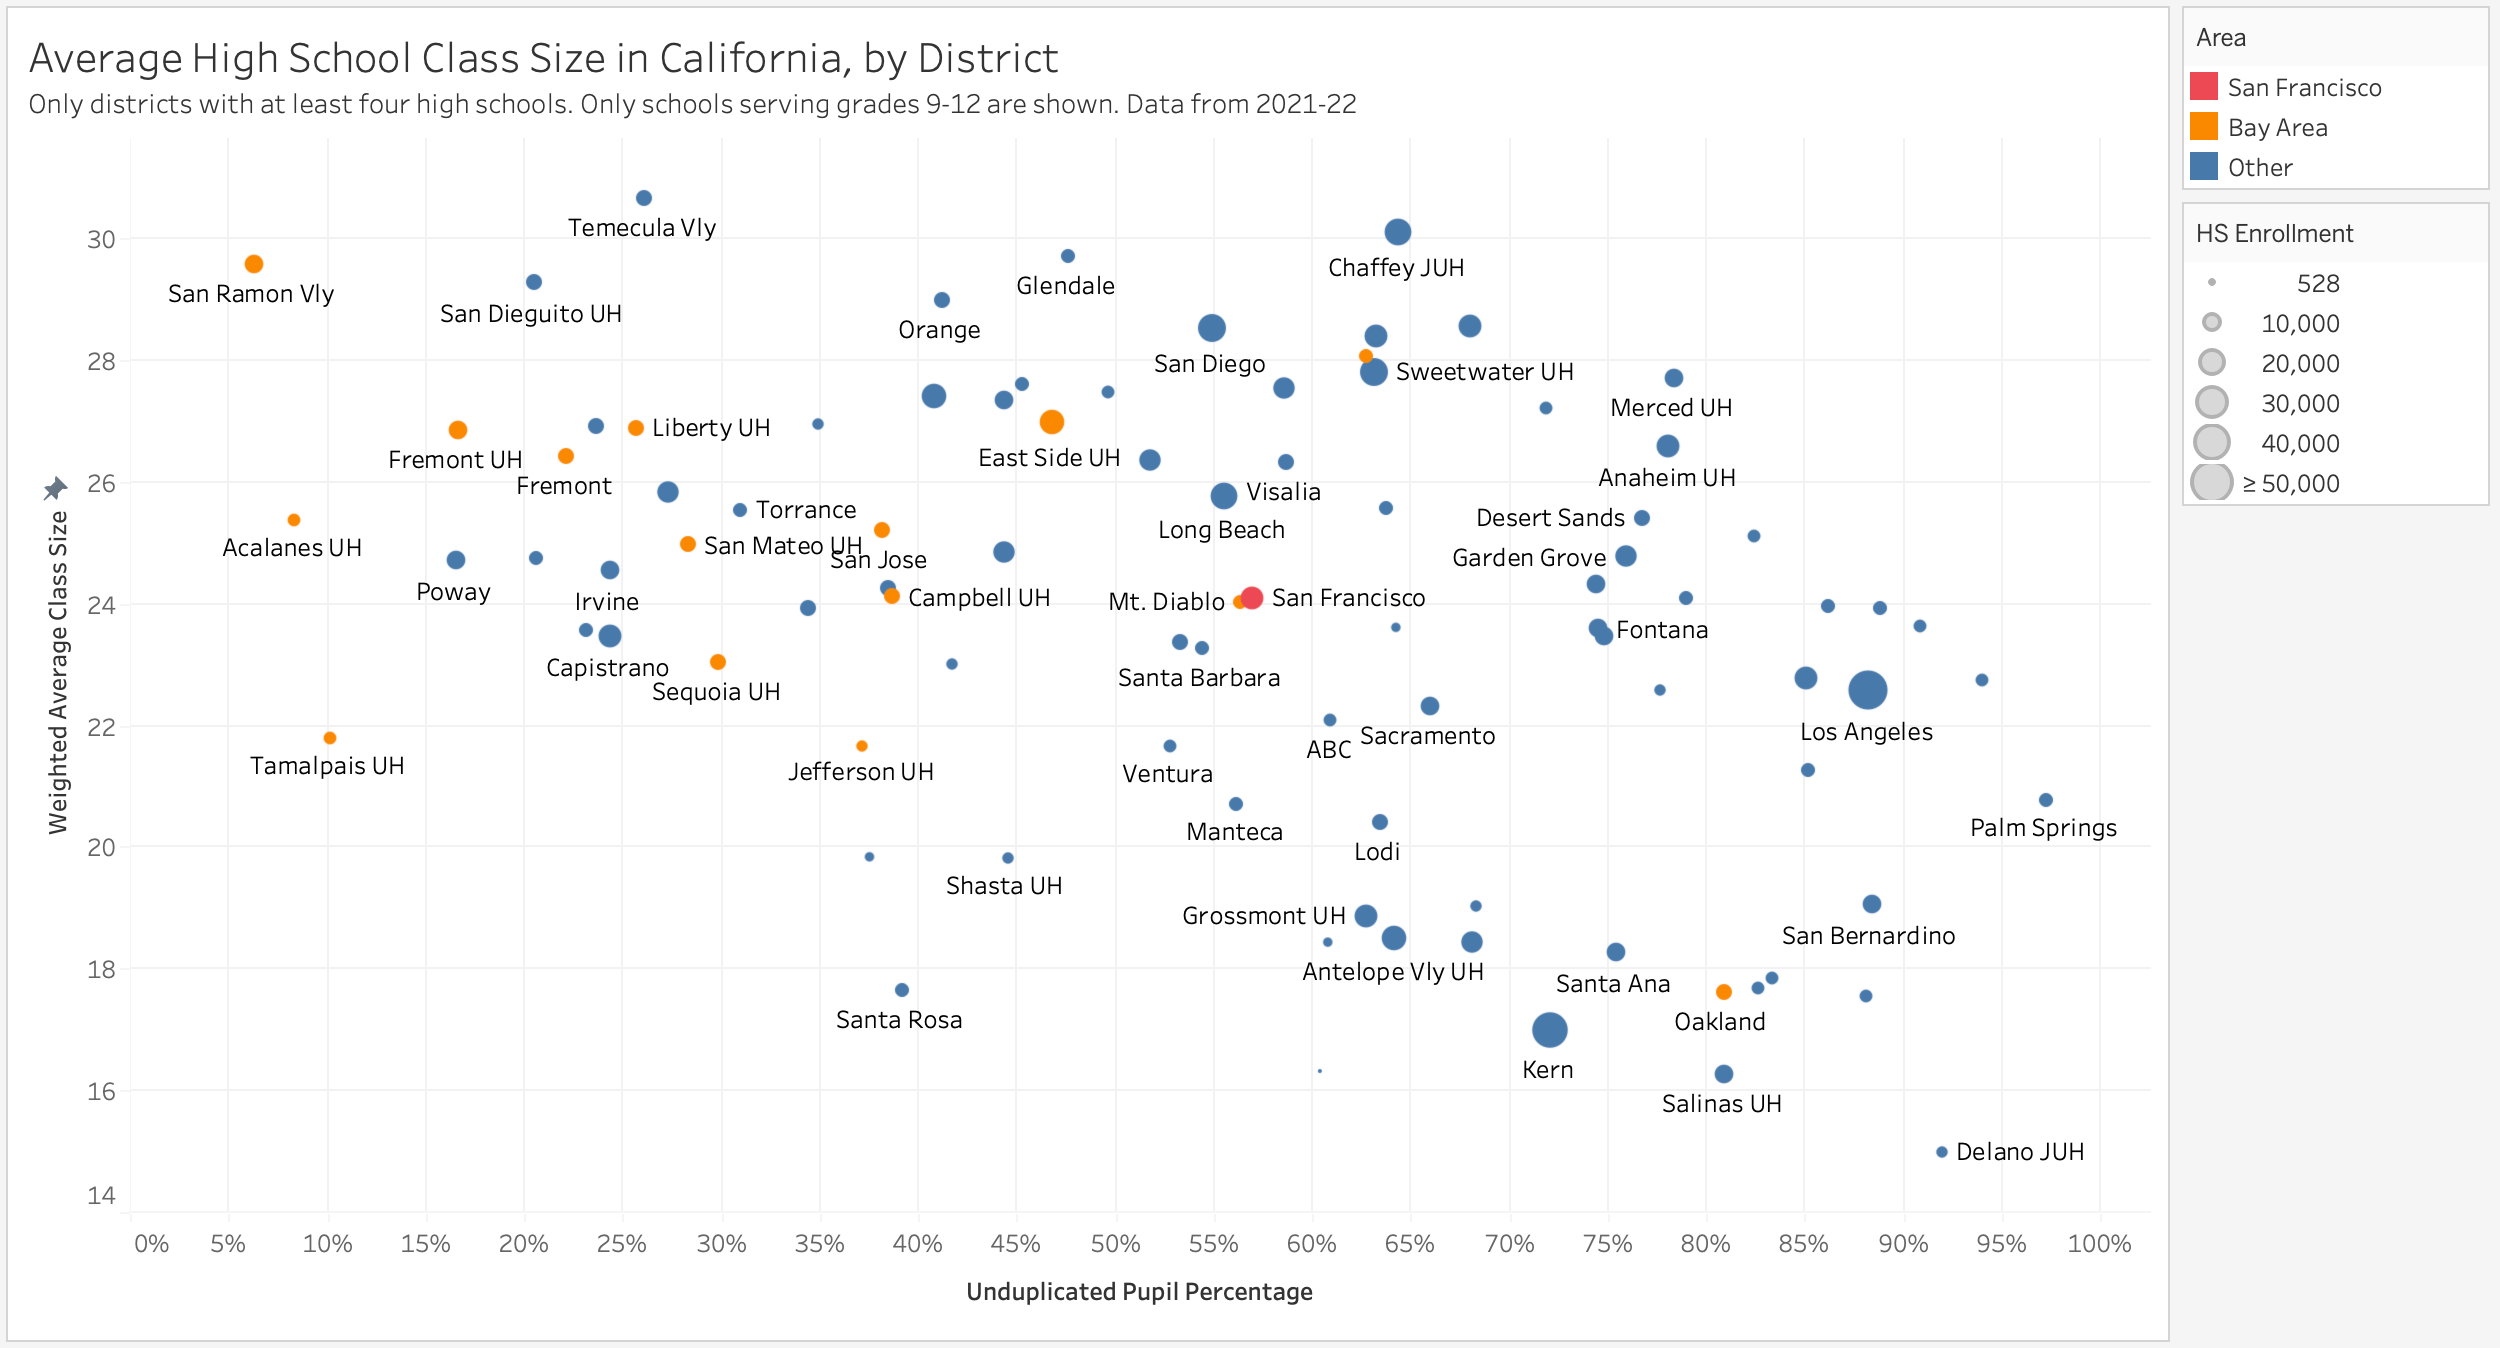
Figure 6 below shows the weighted average class size for all high schools in a district. San Francisco’s average class size of 24 is very much in line with the average of other districts.
In contrast, San Francisco’s elementary class sizes were among the lowest in the state and middle school class sizes were well below the average. San Francisco has, consciously or not, invested more in the elementary grades than in the high school grades.
That is in line with the commonly expressed viewpoint1 that districts should pay more attention to the elementary school years because once students fall behind they rarely catch up. San Francisco has done what the common wisdom suggests it should do without obtaining the results than the common wisdom suggests it should have.
It’s worth noting that these are the class sizes for the 2021-22 academic year, after which the district imposed budget cuts that disproportionately affected some of the high schools, causing Lowell’s principal, who was in his first year in the job, to quit in protest to become a principal in Marin. It’ll be interesting to see the 2022-23 class sizes when those come out.
As a very very unscientific data point, my kids’ dentist has volunteered this view to me more than once.
Schools with more low income and low performing students have smaller class sizes. Lowell average math class has 29 students, Thurgood Marshall 20 and Well 12.
What does unduplicated pupil percentage mean? I googled and the best I could come up with is the percentage of kids who are one of : (eligible for free or reduced price school meals, are English Learners, or are foster youth). So the kids at SOTA tend have less need, which jibes with what my daughter says. She says a lot of K-8 private school kids go there, which she thinks is annoying but to me speaks to the high quality of the education there. All of our high schools should be competitive with private schools.
I am of the impression that SFUSD generally has good high schools, at least for the vast majority of kids: Lowell, SOTA, and Lincoln are great. Washington, Balboa, and Galileo are very good and Wallenberg, Burton and Academy are not bad. The rest have some obvious issues, most obviously low graduation rates but all but Mission are small in aggregate about 20% of all students.
I know people who think that all schools should offer a great education, and it's hard to disagree but not everyone can be above average either.